Overview
The data visualization in RadChart is done by a hierarchy of classes that inherit from the ChartSeries class. Each series has a collection of data points, that is the view model of the data. A series may have its data populated directly through the DataPoints property (unbound mode) or by data-binding to an arbitrary IEnumerable instance through the ItemsSource property. When a series is data-bound it will internally populate its DataPoints collection. A series may work either in bound or unbound mode, but not in both.
Series Class Hierarchy
Concrete series types are available for specific charts. For example, there is a set of CartesianSeries applicable in the context of a RadCartesianChart.
Figure 1: Series Class Diagram
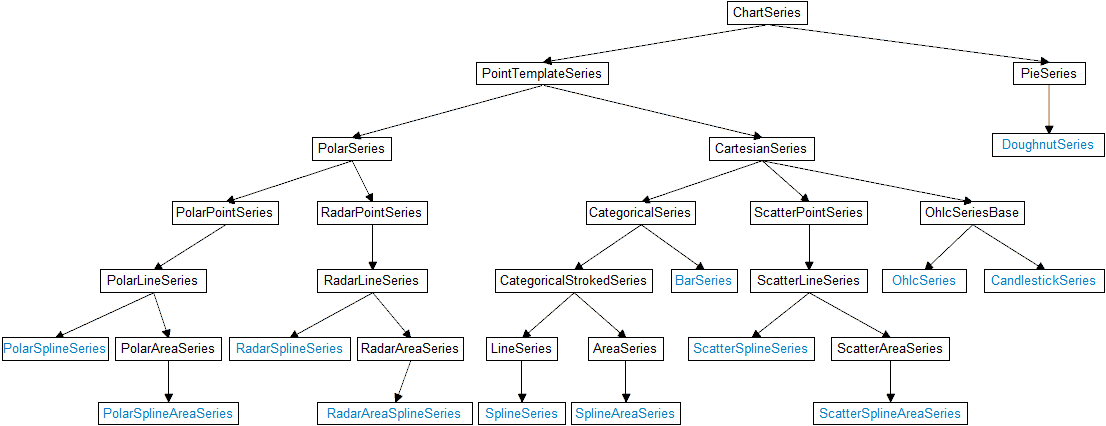
You can find all of the different series grouped by the type of chart where they can be shown below.