Color Palette
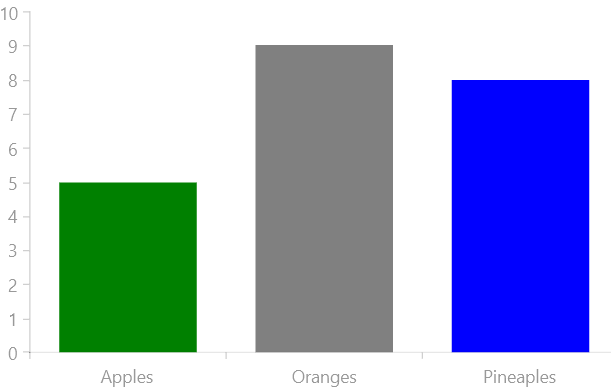
The Chart color palette is a colorization mechanism that allow you to define a set of strokes and fills, which are automatically applied to the visual elements representing the chart data (like bars, lines, slices, etc.).
The Chart palette system is index based, which means that the first color from the palette will be applied to the first chart series, the second color to the second series and so on. When you reach the last color from the palette, the colors will start applying for the first color all over again.
To use the palette mechanism, create a ChartPalette instance and populate its FillEntries and StrokeEntries collections with Brush objects.
Define the Palette in Code
The following examples show how to implement a custom ChartPalette and assign it to the Palette property of the chart using C# code.
Creating a custom palette in code
public static class CustomPalettes
{
    static CustomPalettes()
    {
        InitializePalette();
    }

    public static ChartPalette CustomPalette { get; private set; }

    private static void InitializePalette()
    {
        ChartPalette palette = new ChartPalette() { Name = "CustomPalette" };

        // fill
        palette.FillEntries.Brushes.Add(new SolidColorBrush(Color.FromArgb(255, 40, 152, 228)));
        palette.FillEntries.Brushes.Add(new SolidColorBrush(Color.FromArgb(255, 255, 205, 0)));
        palette.FillEntries.Brushes.Add(new SolidColorBrush(Color.FromArgb(255, 255, 60, 0)));
        palette.FillEntries.Brushes.Add(new SolidColorBrush(Color.FromArgb(255, 210, 202, 202)));
        palette.FillEntries.Brushes.Add(new SolidColorBrush(Color.FromArgb(255, 67, 67, 67)));
        palette.FillEntries.Brushes.Add(new SolidColorBrush(Color.FromArgb(255, 0, 255, 156)));
        palette.FillEntries.Brushes.Add(new SolidColorBrush(Color.FromArgb(255, 109, 49, 255)));
        palette.FillEntries.Brushes.Add(new SolidColorBrush(Color.FromArgb(255, 0, 178, 161)));
        palette.FillEntries.Brushes.Add(new SolidColorBrush(Color.FromArgb(255, 109, 255, 0)));
        palette.FillEntries.Brushes.Add(new SolidColorBrush(Color.FromArgb(255, 255, 128, 0)));

        // stroke
        palette.StrokeEntries.Brushes.Add(new SolidColorBrush(Color.FromArgb(255, 96, 194, 255)));
        palette.StrokeEntries.Brushes.Add(new SolidColorBrush(Color.FromArgb(255, 255, 225, 122)));
        palette.StrokeEntries.Brushes.Add(new SolidColorBrush(Color.FromArgb(255, 255, 108, 79)));
        palette.StrokeEntries.Brushes.Add(new SolidColorBrush(Color.FromArgb(255, 229, 229, 229)));
        palette.StrokeEntries.Brushes.Add(new SolidColorBrush(Color.FromArgb(255, 84, 84, 84)));
        palette.StrokeEntries.Brushes.Add(new SolidColorBrush(Color.FromArgb(255, 0, 255, 156)));
        palette.StrokeEntries.Brushes.Add(new SolidColorBrush(Color.FromArgb(255, 130, 79, 255)));
        palette.StrokeEntries.Brushes.Add(new SolidColorBrush(Color.FromArgb(255, 69, 204, 191)));
        palette.StrokeEntries.Brushes.Add(new SolidColorBrush(Color.FromArgb(255, 185, 255, 133)));
        palette.StrokeEntries.Brushes.Add(new SolidColorBrush(Color.FromArgb(255, 255, 175, 94)));

        CustomPalette = palette;
    }
}
Setting the Palette property of the chart in code
private void RadCartesianChart_Loaded(object sender, RoutedEventArgs e)
{
    this.chart.Palette = CustomPalettes.CustomPalette;
}
Define the Palette in XAML
The following examples show how to implement a custom ChartPalette and assign it to the Palette property of the chart using XAML.
Creating a custom palette in xaml
<telerik:RadCartesianChart>
    <telerik:RadCartesianChart.HorizontalAxis>
        <telerik:CategoricalAxis/>
    </telerik:RadCartesianChart.HorizontalAxis>
    <telerik:RadCartesianChart.VerticalAxis >
        <telerik:LinearAxis />
    </telerik:RadCartesianChart.VerticalAxis>

    <telerik:RadCartesianChart.Series>
        <telerik:PointSeries ZIndex="100">
            <telerik:PointSeries.DataPoints >
                <telerikCharting:CategoricalDataPoint Category="January" Value="1" />
                <telerikCharting:CategoricalDataPoint Category="February" Value="5" />
            </telerik:PointSeries.DataPoints>
        </telerik:PointSeries>
        <telerik:BarSeries>
            <telerik:BarSeries.DataPoints>
                <telerikCharting:CategoricalDataPoint Category="January" Value="3" />
                <telerikCharting:CategoricalDataPoint Category="February" Value="5" />
            </telerik:BarSeries.DataPoints>
        </telerik:BarSeries>
    </telerik:RadCartesianChart.Series>
</telerik:RadCartesianChart>
