Radar Line Series
The RadarLineSeries are represented on the chart as data points connected with straight line segments.
Properties
RadarLineSeries class inherits from the RadarPointSeries class - See the inherited properties.
- Stroke (Brush): Gets or sets the Brush instance that defines the stroke of the Line shape that presents the series.
- StrokeThickness (double): Gets or sets the thickness of the line used to present the series.
- IsClosed (bool): Gets or sets a value indicating whether the Line shape will be closed (connecting the last point to the first one). The default value is true.
- AutoSortPoints (bool): Gets or sets a value indicating whether the data points associated with the series will be automatically sorted by their Category property in ascending order. The default value is true.
Example
Examples 1 and 2 show how to create RadCartesianChart with a RadarLineSeries.
Example 1: Defining the model and populating with data
public sealed partial class MainPage : Page
{
    public MainPage()
    {
        this.InitializeComponent();

        List<Data> data = new List<Data>();
        for (double i = 1; i < 30; i += 1)
        {
            data.Add(new Data() { Category = i, Value = ((0.7) * Math.Cos(20 * i)) });
        }

        this.polarChart.DataContext = data;
    }
}

public class Data
{
    public double Value { get; set; }

    public double Category { get; set; }
}
Example 2: Defining the RadPolarChart and RadarLineSeries
<Grid xmlns:telerikChart="using:Telerik.UI.Xaml.Controls.Chart">
    <telerikChart:RadPolarChart x:Name="polarChart">
        <telerikChart:RadPolarChart.PolarAxis>
            <telerikChart:PolarAxis/>
        </telerikChart:RadPolarChart.PolarAxis>
        <telerikChart:RadPolarChart.RadialAxis>
            <telerikChart:CategoricalRadialAxis />
        </telerikChart:RadPolarChart.RadialAxis>

        <telerikChart:RadarLineSeries ItemsSource="{Binding}">
            <telerikChart:RadarLineSeries.ValueBinding>
                <telerikChart:PropertyNameDataPointBinding PropertyName="Value"/>
            </telerikChart:RadarLineSeries.ValueBinding>
            <telerikChart:RadarLineSeries.CategoryBinding>
                <telerikChart:PropertyNameDataPointBinding PropertyName="Category"/>
            </telerikChart:RadarLineSeries.CategoryBinding>
        </telerikChart:RadarLineSeries>
    </telerikChart:RadPolarChart>
</Grid>
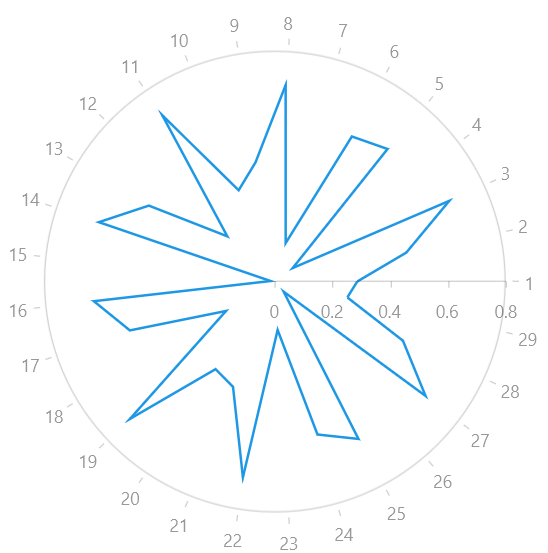
Figure 1: RadPolarChart and RadarLineSeries