Spline Series
The SplineSeries are represented on the chart as data points connected with smooth line segments.
The
SplineSeriesclass inherits from theLineSeriesclass - See the inherited properties.
Example
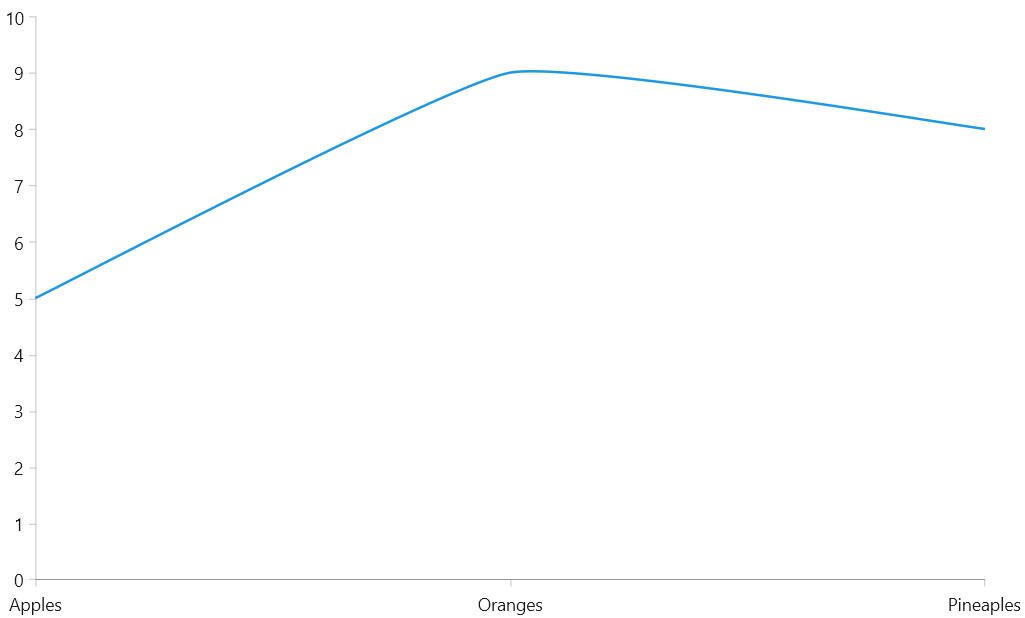
The following example shows how to create a RadCartesianChart with a SplineSeries.
Defining the model
public class Data
{
    public string Category { get; set; }

    public double Value { get; set; }
}
Populating with data
public MainPage()
{
    this.InitializeComponent();

    List<Data> data = new List<Data>
    {
        new Data() { Category = "Apples", Value = 5 },
        new Data() { Category = "Oranges", Value = 9 },
        new Data() { Category = "Pineaples", Value = 8 }
    };

    this.radCartesianChart.DataContext = data;
}
Defining the RadCartesianChart and SplineSeries
<Grid xmlns:telerikChart="using:Telerik.UI.Xaml.Controls.Chart">
    <telerikChart:RadCartesianChart x:Name="radCartesianChart">
        <telerikChart:RadCartesianChart.VerticalAxis>
            <telerikChart:LinearAxis/>
        </telerikChart:RadCartesianChart.VerticalAxis>
        <telerikChart:RadCartesianChart.HorizontalAxis>
            <telerikChart:CategoricalAxis/>
        </telerikChart:RadCartesianChart.HorizontalAxis>

        <telerikChart:SplineSeries ItemsSource="{Binding}">
            <telerikChart:SplineSeries.CategoryBinding>
                <telerikChart:PropertyNameDataPointBinding PropertyName="Category"/>
            </telerikChart:SplineSeries.CategoryBinding>
            <telerikChart:SplineSeries.ValueBinding>
                <telerikChart:PropertyNameDataPointBinding PropertyName="Value"/>
            </telerikChart:SplineSeries.ValueBinding>
        </telerikChart:SplineSeries>
    </telerikChart:RadCartesianChart>
</Grid>
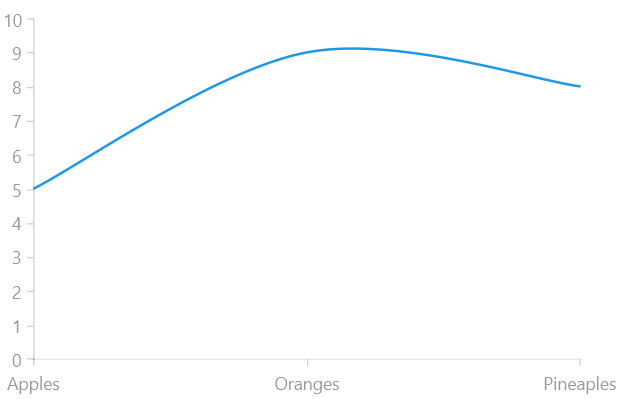
Spline Tension
The spline-type series provides a property that allows you to control the tension of the spline. To do so, set the SplineTension property. The tension works with relative values between 0 and 1. The defualt tension is set to 0.5.
Setting the SplineTension property
<telerikChart:RadCartesianChart x:Name="radCartesianChart">
    <telerikChart:RadCartesianChart.VerticalAxis>
        <telerikChart:LinearAxis/>
    </telerikChart:RadCartesianChart.VerticalAxis>
    <telerikChart:RadCartesianChart.HorizontalAxis>
        <telerikChart:CategoricalAxis/>
    </telerikChart:RadCartesianChart.HorizontalAxis>

    <telerikChart:SplineSeries ItemsSource="{Binding}" SplineTension="0.2">
        <telerikChart:SplineSeries.CategoryBinding>
            <telerikChart:PropertyNameDataPointBinding PropertyName="Category"/>
        </telerikChart:SplineSeries.CategoryBinding>
        <telerikChart:SplineSeries.ValueBinding>
            <telerikChart:PropertyNameDataPointBinding PropertyName="Value"/>
        </telerikChart:SplineSeries.ValueBinding>
    </telerikChart:SplineSeries>
</telerikChart:RadCartesianChart>