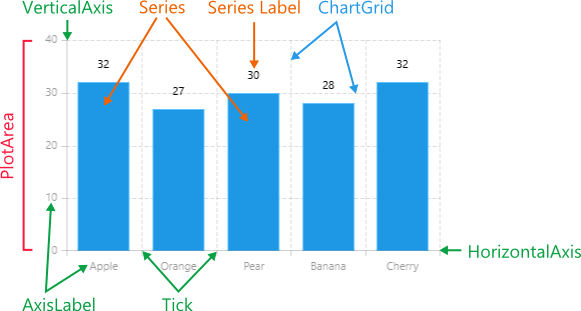
Visual Structure
The following topic describes all the visual elements and terms used in a standard Chart component.
- PlotArea—The area that contains the data series (on the image it is the area inside the rectangle defined by the axes).
- Series—The visual representation of the data.
- SeriesLabels—Labels that provide specific information about the data points in the series.
- VerticalAxis/HorizontalAxis—Axes that define the coordinate system used to plot the data.
- Tick—Marks specific values on the axes.
- AxisLabel—Labels for specific values on the axes.
- ChartGrid—Grid lines that mark specific values on the chart area