Getting Started with WinUI Chart
This guide provides the information you need to start using the Telerik UI for WinUI Chart by adding the component to your project.
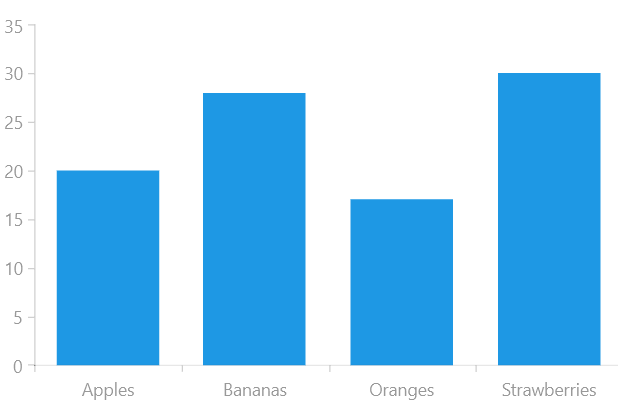
At the end, you will be able to achieve the following result.
Prerequisites
Before adding the Badge, you need to:
-
Create your Telerik UI for WinUI application and install the Telerik UI for WinUI components depending on the required installation approach:
Add the Assembly References
To use the Chart components, add references to Telerik.WinUI.Controls.dll and Telerik.Licensing.Runtime.dll.
Define the Component
The RadChart suite comes with several charting components suitable for different visualizations - Cartesian, pie and polar. The following example demonstrates how to define a RadCartesianChart component.
You can access the Cartesian chart through the xmlns:telerikChart="using:Telerik.UI.Xaml.Controls.Chart" alias that points to the Telerik.UI.Xaml.Controls.Chart namespace.
Defining a RadCartesianChart
<Grid xmlns:telerikChart="using:Telerik.UI.Xaml.Controls.Chart">
    <telerikChart:RadCartesianChart />
</Grid>
The Cartesian coordinate system is constructed using horizontal and vertical axes. The RadChart suite exposes different types of axes that can be combined horizontally and vertically in different ways based on the scenario. You can find more information about them in our Axis article.
Define the Axes
The following example demonstrates a common scenario with a LinearAxis as the vertical axis of the chart and a CategoricalAxis as horizontal axis of the chart.
Defining the horizontal and vertical axes
<telerikChart:RadCartesianChart>
    <telerikChart:RadCartesianChart.HorizontalAxis>
        <telerikChart:CategoricalAxis/>
    </telerikChart:RadCartesianChart.HorizontalAxis>
    <telerikChart:RadCartesianChart.VerticalAxis>
        <telerikChart:LinearAxis/>
    </telerikChart:RadCartesianChart.VerticalAxis>
</telerikChart:RadCartesianChart>
RadCartesianChart without any series added in its Series collection

Define a Series
The Chart exposes a large variety of series that can be used in different scenarios. You can take a look at the Series Overview article to find out more about the available types.
The following example shows how to to add a BarSeries and populate its DataPoints collection with CategoricalDataPoint objects. This will generate a set of bars which height is determined by the Value property of the data point.
Defining BarSeries
<Grid xmlns:telerikChart="using:Telerik.UI.Xaml.Controls.Chart"
      xmlns:telerikCharting="using:Telerik.Charting">
    <telerikChart:RadCartesianChart>
        <telerikChart:RadCartesianChart.HorizontalAxis>
            <telerikChart:CategoricalAxis/>
        </telerikChart:RadCartesianChart.HorizontalAxis>
        <telerikChart:RadCartesianChart.VerticalAxis>
            <telerikChart:LinearAxis/>
        </telerikChart:RadCartesianChart.VerticalAxis>

        <telerikChart:BarSeries>
            <telerikChart:BarSeries.DataPoints>
                <telerikCharting:CategoricalDataPoint Category="Apples" Value="20"/>
                <telerikCharting:CategoricalDataPoint Category="Bananas" Value="28"/>
                <telerikCharting:CategoricalDataPoint Category="Oranges" Value="17"/>
                <telerikCharting:CategoricalDataPoint Category="Strawberries" Value="30"/>
            </telerikChart:BarSeries.DataPoints>
        </telerikChart:BarSeries>
    </telerikChart:RadCartesianChart>
</Grid>
Telerik UI for WinUI Learning Resources
- Telerik UI for WinUI Chart Component
- Getting Started with Telerik UI for WinUI Components
- Telerik UI for WinUI Installation
- Telerik UI for WinUI Examples
- Telerik UI for WinUI Accessibility
- Telerik UI for WinUI License Agreement