Chart Grid
The chart grid is used to decorate the chart plot area with lines and stripes.
The different chart types are represented by different grid elements. The grid adds lines connected to each major tick of each axis and stripes between the ticks. The following documentation shows how to add the grids for the Cartesian and Polar charts, which are the ones supporting the grid feature.
Cartesian Chart Grid
The grid for the CartesianChart is displayed using the CartesianChartGrid. The grid provides the following set of properties:
-
MajorLinesVisibility—Defines which lines (for the vertical axis, the horizontal or both)) are displayed in the grid.
-
StripLinesVisibility—Defines the stripes visibility.
-
DefaultStripeBrush—Sets the default brush applied to the stripes.
-
XStripeBrushes—Sets the collection of brushes that apply to the stripes on the horizontal axis. Those are the vertical stripes.
-
YStripeBrushes—Sets the collection of brushes that apply to the stripes on the vertical axis. Those are the horizontal stripes.
-
MajorXLineStyle—Sets aStylethat defines the appearance of the vertical lines (plotted on the horizontal axis) within the grid. The style should target theLinetype.
-
MajorYLineStyle—Sets aStylethat defines the appearance of the horizontal lines (plotted on the vertical axis) within the grid. The style should target theLinetype.
-
MajorXLinesRenderMode—Sets the visualization behavior of the vertical lines that are plotted on the horizontal axis. You can use this property to draw only the first or the last line, only the first and the last, only the lines in between and few more options.
-
MajorYLinesRenderMode—Sets the visualization behavior of the horizontal lines that are plotted on the vertical axis. You can use this property to draw only the first or the last line, only the first and the last, only the lines in between and few more options.
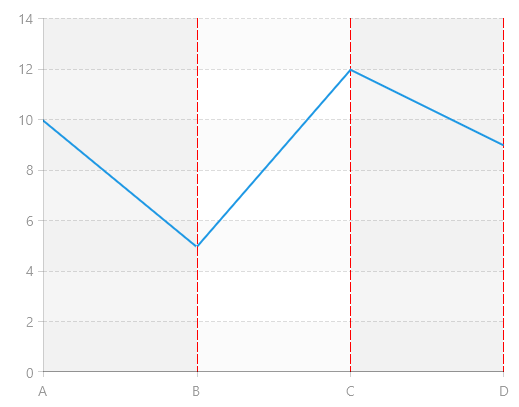
Defining CartesianChartGrid
<telerikChart:RadCartesianChart>
    <telerikChart:RadCartesianChart.VerticalAxis>
        <telerikChart:LinearAxis/>
    </telerikChart:RadCartesianChart.VerticalAxis>
    <telerikChart:RadCartesianChart.HorizontalAxis>
        <telerikChart:CategoricalAxis/>
    </telerikChart:RadCartesianChart.HorizontalAxis>
    <telerikChart:RadCartesianChart.Grid>
        <telerikChart:CartesianChartGrid MajorStripLinesVisibility="XY" MajorGridLinesVisibility="XY">
            <telerikChart:CartesianChartGrid.MajorXLineStyle>
                <Style TargetType="Line">
                    <Setter Property="Stroke"  Value="Red"/>
                    <Setter Property="StrokeDashArray" Value="10, 2"/>
                </Style>
            </telerikChart:CartesianChartGrid.MajorXLineStyle>
            <telerikChart:CartesianChartGrid.YStripeBrushes>
                <SolidColorBrush Color="#11CACACA"/>
                <SolidColorBrush Color="Transparent"/>
            </telerikChart:CartesianChartGrid.YStripeBrushes>
        </telerikChart:CartesianChartGrid>
    </telerikChart:RadCartesianChart.Grid>
    <telerikChart:LineSeries>
        <telerikChart:LineSeries.DataPoints>
            <telerikCharting:CategoricalDataPoint Category="A" Value="10"/>
            <telerikCharting:CategoricalDataPoint Category="B" Value="5"/>
            <telerikCharting:CategoricalDataPoint Category="C" Value="12"/>
            <telerikCharting:CategoricalDataPoint Category="D" Value="9"/>
        </telerikChart:LineSeries.DataPoints>
    </telerikChart:LineSeries>
</telerikChart:RadCartesianChart>
Polar Chart Grid
The grid for the PolarChart is displayed using the PolarChartGrid. The grid provides the following set of properties:
-
DefaultStripeBrush—Set the default brush applied to the stripes.
-
RadialStripeBrushes—Sets a collection of brushes that are applied to the stripes on the radial axis.
-
MajorGridLineVisibility—Defines which lines (polar, radial or both) are displayed in the grid. This is related to the lines snapped to the major ticks of the axis.
-
MinorGridLineVisibility—Defines which lines (polar, radial or both) are displayed in the grid. This is related to the lines snapped to the minor ticks of the axis.
-
StripesVisibility—Defines which stripes (polar, radial or both) are displayed in the grid.
-
PolarLineStyle—Sets aStylethat defines the appearance of the polar (radius) lines in the grid. The style should target theLinetype.
-
MajorRadialLineStyle—Sets aStylethat defines the appearance of the radial (angle) lines snapped to the major ticks of the axis. The style should target theEllipsetype.
-
MinorRadialLineStyle—Sets aStylethat defines the appearance of the radial (angle) lines snapped to the minor ticks of the axis. The style should target theEllipsetype.
-
MajorPolarLineStyle—Sets aStylethat defines the appearance of the polar (radius) lines snapped to the minor ticks of the axis. The style should target theLinetype.
-
MinorPolarLineStyle—Sets aStylethat defines the appearance of the polar (radius) lines snapped to the minor ticks of the axis. The style should target theLinetype.
Defining PolarChartGrid
<telerikChart:RadPolarChart>
    <telerikChart:RadPolarChart.PolarAxis>
        <telerikChart:PolarAxis/>
    </telerikChart:RadPolarChart.PolarAxis>
    <telerikChart:RadPolarChart.RadialAxis>
        <telerikChart:CategoricalRadialAxis/>
    </telerikChart:RadPolarChart.RadialAxis>
    <telerikChart:RadPolarChart.Grid>
            <telerikChart:PolarChartGrid MajorGridLinesVisibility="Both" MajorStripesVisibility="Both">
                <telerikChart:PolarChartGrid.MajorRadialLinesStyle>
                    <Style TargetType="Ellipse">
                    <Setter Property="Stroke" Value="#F56147"/>
                    </Style>
                </telerikChart:PolarChartGrid.MajorRadialLinesStyle>
            </telerikChart:PolarChartGrid>
    </telerikChart:RadPolarChart.Grid>
    <telerikChart:RadarLineSeries>
        <telerikChart:RadarLineSeries.DataPoints>
            <telerikCharting:CategoricalDataPoint Category="A" Value="10"/>
            <telerikCharting:CategoricalDataPoint Category="B" Value="5"/>
            <telerikCharting:CategoricalDataPoint Category="C" Value="12"/>
            <telerikCharting:CategoricalDataPoint Category="D" Value="9"/>
            <telerikCharting:CategoricalDataPoint Category="E" Value="3"/>
        </telerikChart:RadarLineSeries.DataPoints>
    </telerikChart:RadarLineSeries>
</telerikChart:RadPolarChart>
