WinUI Chart Overview
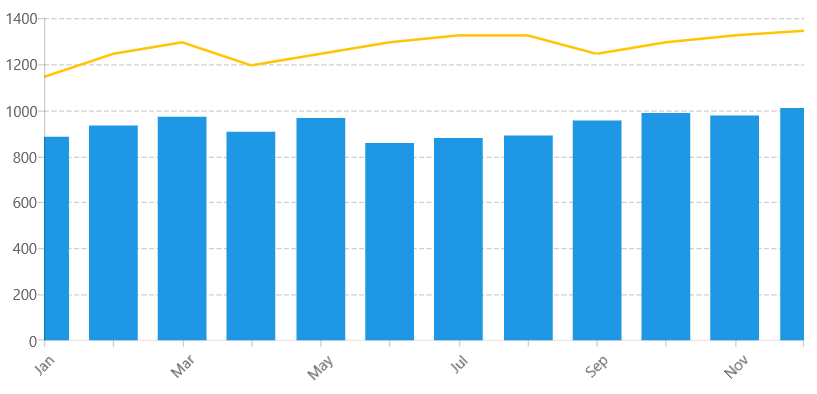
RadChart for WinUI is a versatile charting component that has been specifically designed from the ground-up with the latest Windows patterns and practices in mind. It offers unmatched performance regarding loading time, drawing capabilities and real-time updates.
Its intuitive object model and public API allow complex charts to be easily setup either in XAML or in code-behind. The control is completely data aware and may work in bound or unbound mode, depending on the requirements. Chart types (or series) are organized in hierarchies, depending on the coordinate system, used to plot data points – for example, we have RadCartesianChart (using the Cartesian coordinate system), RadPolarChart (using the radial coordinate system) and RadPieChart (using pie slices for proportional data visualization).
A charting component in general is used to visualize (or plot) some data in a human-readable way through different representations like lines, areas, bars, pies, etc. Each series has a collection of data points – the data equivalent of a 2D point – and knows how to visualize them. Different series types may process certain types of data points – for example, categorical series may contain categorical data points. Data points may be added directly to series or a data binding mechanism may be used to create the appropriate data points from the raw data.
The Chart is part of Telerik UI for WinUI, a
professional grade UI component library for building modern and feature-rich applications. To try it out sign up for a free 30-day trial.

Key Features
- Different types of data visualization—The chart provides a set of different data representations like line, points, area, pie, bars, etc.
- Behaviors—The interaction with the charts happens via several built-in behavior. This includes selection, zooming and scrolling, tooltip and trackball behaviors.
- Annotations—Annotations are visual elements used to highlight certain areas on the plot. They can be used as comments or as markers for specific values on the plot.
- Data Point Labels—The control allows you to enable and customize labels displayed for the data points plotted on the chart.
- Legend—The legend support in the chart is implemented via the RadLegendControl that allows you to display additional information for the ploted data. This helps you to enrich the end user's understanding of the data.
- Grid Lines—The Cartesian and Polar charts can be optionally decorated with grid lines and stripes displayed along the horizontal or vertical axis.
- Localization—Localization is the translation of application resources into localized versions for the specific cultures or into customized resources. Telerik allows you to implement custom localization.