Minor Ticks and Stripes
As of R2 2022 the RadChart control allows you to display minor ticks and stripes in addition to the major ticks and stripes.
Minor Ticks
The minor ticks functionality is supported by the following types of axes:
-
NumericalAxis(LinearAxisandLogarithmicAxis) DateTimeContinuousAxisPolarAxisNumericalRadialAxis
The visibility and appearance of the minor ticks can be controlled via the following properties of these axes:
-
MinorTicksPerMajor—The number of minor ticks per major interval. -
MinorTickLength—The length of the minor tick. -
MinorTickOffset—Index-based offset of the first tick to be displayed. -
MinorTickTemplate—The template that defines the appearance of all minor ticks present on the axis. -
MinorTickStyle—The style for eachRectangleinstance created to represent a minor tick when noMinorTickTemplateis specified.
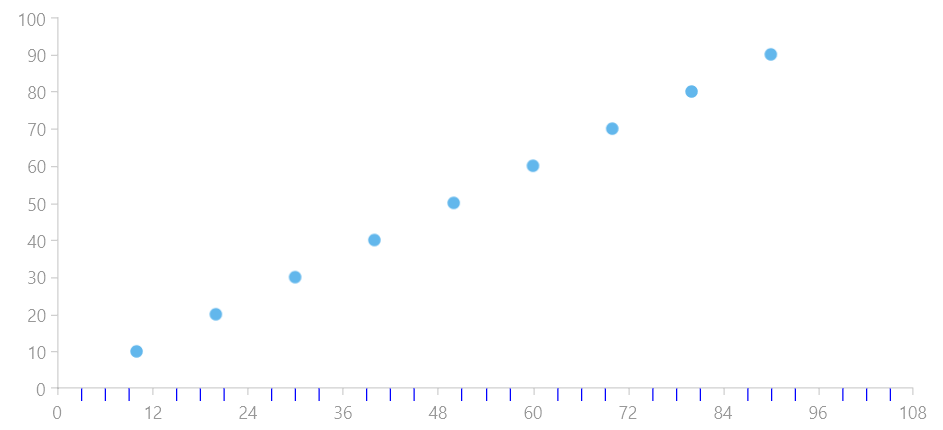
Cartesian Chart with customized minor ticks
<telerik:RadCartesianChart>
    <telerik:RadCartesianChart.HorizontalAxis>
        <telerik:LinearAxis Maximum="100"
                            DesiredTickCount="10"
                            MinorTicksPerMajor="3"
                            MinorTickLength="10">
            <telerik:LinearAxis.MinorTickStyle>
                <Style TargetType="Rectangle">
                    <Setter Property="Fill" Value="Blue" />
                </Style>
            </telerik:LinearAxis.MinorTickStyle>
        </telerik:LinearAxis>
    </telerik:RadCartesianChart.HorizontalAxis>
    <telerik:RadCartesianChart.VerticalAxis>
        <telerik:LinearAxis Maximum="100" />
    </telerik:RadCartesianChart.VerticalAxis>
    <telerik:RadCartesianChart.Series>
        <telerik:ScatterPointSeries ItemsSource="{Binding}">
                <!-- ... -->
        </telerik:ScatterPointSeries>
    </telerik:RadCartesianChart.Series>
</telerik:RadCartesianChart>
Stripes
In addition to the new minor tick functionality, both the CartesianChartGrid and PolarChartGrid now expose properties to control the visibility and appearance of the minor grid and strip lines.
CartesianChartGrid
The CartesianChartGrid provides the following properties for customization of the grid and strip lines:
-
MinorGridLinesVisibility—The visibility of minor grid lines. A value of typeGridLineVisibilitywhich can be eitherNone,X,YorXY. -
MinorStripLinesVisibility—The visibility of the grid's stripes. A value of typeGridLineVisibilitywhich can be eitherNone,X,YorXY. -
MinorXLineStyle—The style that defines the appearance of the minor lines along the X-axis. -
MinorYLineStyle—The style that defines the appearance of the minor lines along the Y-axis. -
MinorXLineDashArray—The dash array used to define each minor X-line StrokeDashArray. -
MinorYLineDashArray—The dash array used to define each minor Y-line StrokeDashArray.
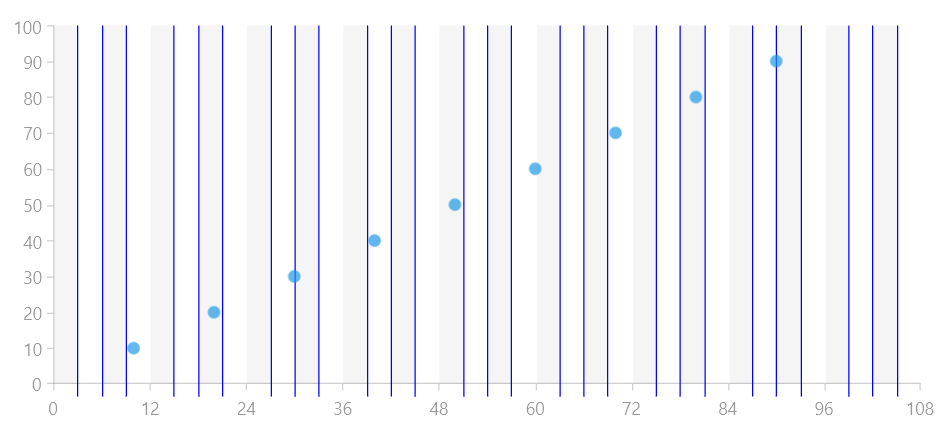
Cartesian Chart with customized CartesianChartGrid
<telerik:RadCartesianChart>
        <telerik:RadCartesianChart.Grid>
            <telerik:CartesianChartGrid MajorGridLinesVisibility="None"
                            MinorGridLinesVisibility="X"
                            MajorStripLinesVisibility="None"
                            MinorStripLinesVisibility="X">
                <telerik:CartesianChartGrid.MinorXLineStyle>
                    <Style TargetType="Line">
                        <Setter Property="Stroke" Value="Blue" />
                    </Style>
                </telerik:CartesianChartGrid.MinorXLineStyle>
            </telerik:CartesianChartGrid>
        </telerik:RadCartesianChart.Grid>
    <!-- Axes defined in previous example -->
</telerik:RadCartesianChart>
PolarChartGrid
The PolarChartGrid provides the following properties for customization of the grid and strip lines:
-
MinorGridLinesVisibility—The visibility of minor grid lines. A value of typePolarGridLineVisibilitywhich can be eitherNone,Radial,PolarorBoth. -
MinorStripesVisibility—The visibility of the grid's stripes. A value of typePolarGridLineVisibilitywhich can be eitherNone,Radial,PolarorBoth. -
MinorPolarLinesStyle—The style that defines the appearance of the minor polar (radius) lines within the grid. -
MinorPolarLineDashArray—TheDoubleCollectionthat defines the pattern of the minor polar (radius) lines within the grid. -
MinorRadialLinesStyle—The style that defines the appearance of the minor radial (angle) lines within the grid. -
MinorRadialDashArray—TheDoubleCollectionthat defines the pattern of the minor radial (angle) lines within the grid.
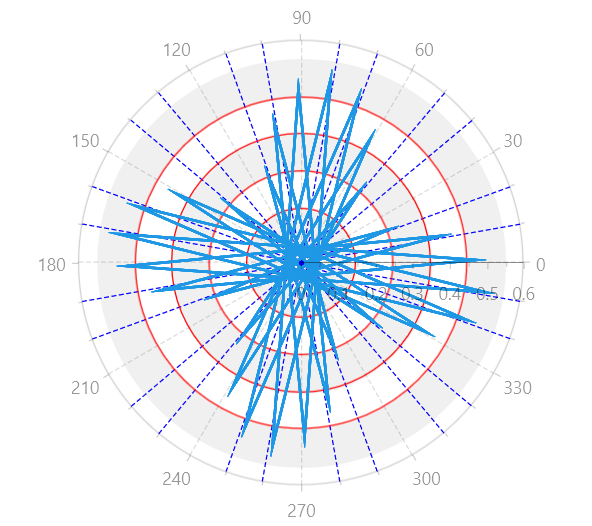
Polar Chart with customized PolarChartGrid
<telerik:RadPolarChart>
    <telerik:RadPolarChart.PolarAxis>
        <telerik:PolarAxis MinorTicksPerMajor="1" />
    </telerik:RadPolarChart.PolarAxis>
    <telerik:RadPolarChart.RadialAxis>
        <telerik:NumericalRadialAxis MinorTicksPerMajor="2" />
    </telerik:RadPolarChart.RadialAxis>
    <telerik:RadPolarChart.Series>
        <telerik:PolarLineSeries ItemsSource="{Binding}">
                <!-- ... -->
        </telerik:PolarLineSeries>
    </telerik:RadPolarChart.Series>
    <telerik:RadPolarChart.Grid>
        <telerik:PolarChartGrid MajorGridLinesVisibility="Both"
                            MinorGridLinesVisibility="Both"
                            MinorStripesVisibility="Radial">
            <telerik:PolarChartGrid.MinorPolarLinesStyle>
                <Style TargetType="Line">
                    <Setter Property="Stroke" Value="Blue" />
                </Style>
            </telerik:PolarChartGrid.MinorPolarLinesStyle>
            <telerik:PolarChartGrid.MinorRadialLinesStyle>
                <Style TargetType="Ellipse">
                    <Setter Property="Stroke" Value="Red" />
                </Style>
            </telerik:PolarChartGrid.MinorRadialLinesStyle>
        </telerik:PolarChartGrid>
    </telerik:RadPolarChart.Grid>
</telerik:RadPolarChart>