OhlcSeries
The OhlcSeries are usually used to represent financial data. The data points representation consists of:
- Vertical line: Shows the price range (the highest and lowest prices) over one unit of time.
-
Tick marks on each side of the line:
- Left - Indicate the opening price for the time period.
- Right - Indicate the closing price for the time period.
- Color hue - Different color hues could be used to indicate whether prices rose or fell in that period.
The OhlcSeries class inherits from the OhlcSeriesBase class - See the inherited properties.
Example
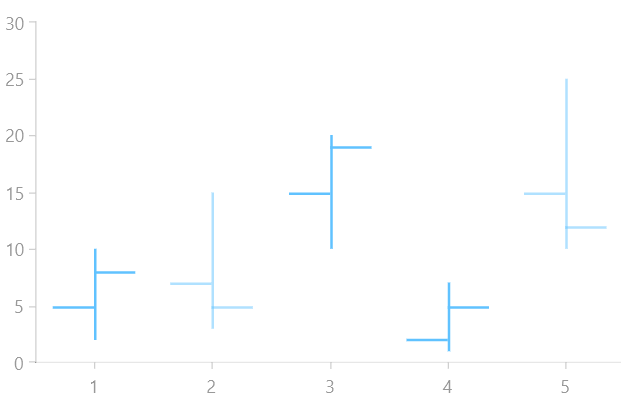
Examples 1,2 and 3 show how to create a RadCartesianChart with OhlcSeries.
Example 1: Defining the model
public class FinancialData
{
    public double High { get; set; }

    public double Low { get; set; }

    public double Open { get; set; }

    public double Close { get; set; }
}
Example 2: Populating with data
public MainPage()
{
    this.InitializeComponent();
    List<FinancialData> sampleData = new List<FinancialData>();
    sampleData.Add(new FinancialData() { High = 10, Open = 5, Low = 2, Close = 8 });
    sampleData.Add(new FinancialData() { High = 15, Open = 7, Low = 3, Close = 5 });
    sampleData.Add(new FinancialData() { High = 20, Open = 15, Low = 10, Close = 19 });
    sampleData.Add(new FinancialData() { High = 7, Open = 2, Low = 1, Close = 5 });
    sampleData.Add(new FinancialData() { High = 25, Open = 15, Low = 10, Close = 12 });

    this.ohlcSeries.DataContext = sampleData;
}
Example 3: Defining the RadCartesianChart and OhlcSeries
<Grid xmlns:telerikChart="using:Telerik.UI.Xaml.Controls.Chart">
    <telerikChart:RadCartesianChart x:Name="ohlcSeries">
        <telerikChart:RadCartesianChart.VerticalAxis>
            <telerikChart:LinearAxis/>
        </telerikChart:RadCartesianChart.VerticalAxis>
        <telerikChart:RadCartesianChart.HorizontalAxis>
            <telerikChart:CategoricalAxis/>
        </telerikChart:RadCartesianChart.HorizontalAxis>

        <telerikChart:OhlcSeries ItemsSource="{Binding}">
            <telerikChart:OhlcSeries.HighBinding>
                <telerikChart:PropertyNameDataPointBinding PropertyName="High"/>
            </telerikChart:OhlcSeries.HighBinding>
            <telerikChart:OhlcSeries.LowBinding>
                <telerikChart:PropertyNameDataPointBinding PropertyName="Low"/>
            </telerikChart:OhlcSeries.LowBinding>
            <telerikChart:OhlcSeries.OpenBinding>
                <telerikChart:PropertyNameDataPointBinding PropertyName="Open"/>
            </telerikChart:OhlcSeries.OpenBinding>
            <telerikChart:OhlcSeries.CloseBinding>
                <telerikChart:PropertyNameDataPointBinding PropertyName="Close"/>
            </telerikChart:OhlcSeries.CloseBinding>
        </telerikChart:OhlcSeries>
    </telerikChart:RadCartesianChart>
</Grid>
Figure 1: Result from Example 3