Scatter Spline Area Series
When using the ScatterSplineAreaSeries the data points are connected with straight line segments and the area enclosed by the line and the coordinate axis may be optionally stroked and/or filled.
The
ScatterSplineAreaSeriesclass inherits from theScatterAreaSeriesclass - See the inherited properties.
Example
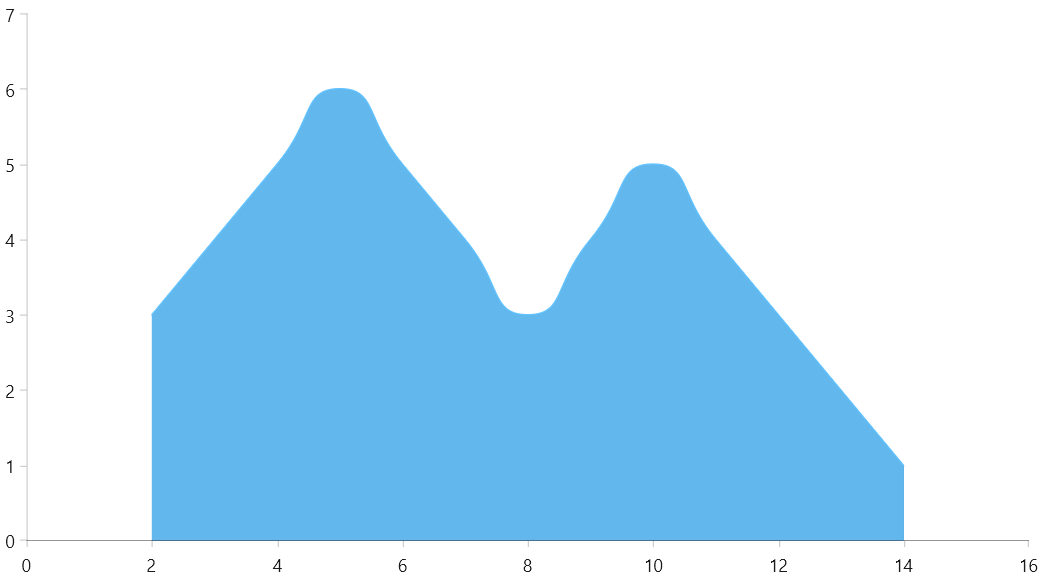
The following example shows how to create a RadCartesianChart with a ScatterSplineAreaSeries.
Defining the model
public class Data
{
    public double Category { get; set; }

    public double Value { get; set; }
}
Populating with data
public MainPage()
{
    this.InitializeComponent();

    List<Data> sampleData = new List<Data>
    {
        new Data() { Category = 2, Value = 3 },
        new Data() { Category = 3, Value = 4 },
        new Data() { Category = 4, Value = 5 },
        new Data() { Category = 5, Value = 6 },
        new Data() { Category = 6, Value = 5 },
        new Data() { Category = 7, Value = 4 },
        new Data() { Category = 8, Value = 3 },
        new Data() { Category = 9, Value = 4 },
        new Data() { Category = 10, Value = 5 },
        new Data() { Category = 11, Value = 4 },
        new Data() { Category = 12, Value = 3 },
        new Data() { Category = 13, Value = 2 },
        new Data() { Category = 14, Value = 1 }
    };

    this.radCartesianChart.DataContext = sampleData;
}
Defining the RadCartesianChart and ScatterSplineAreaSeries
<Grid xmlns:telerikChart="using:Telerik.UI.Xaml.Controls.Chart">
    <telerikChart:RadCartesianChart x:Name="radCartesianChart">
        <telerikChart:RadCartesianChart.VerticalAxis>
            <telerikChart:LinearAxis/>
        </telerikChart:RadCartesianChart.VerticalAxis>
        <telerikChart:RadCartesianChart.HorizontalAxis>
            <telerikChart:LinearAxis/>
        </telerikChart:RadCartesianChart.HorizontalAxis>

        <telerikChart:ScatterSplineAreaSeries ItemsSource="{Binding}">
            <telerikChart:ScatterSplineAreaSeries.XValueBinding>
                <telerikChart:PropertyNameDataPointBinding PropertyName="Category"/>
            </telerikChart:ScatterSplineAreaSeries.XValueBinding>
            <telerikChart:ScatterSplineAreaSeries.YValueBinding>
                <telerikChart:PropertyNameDataPointBinding PropertyName="Value"/>
            </telerikChart:ScatterSplineAreaSeries.YValueBinding>
        </telerikChart:ScatterSplineAreaSeries>
    </telerikChart:RadCartesianChart>
</Grid>
Spline Tension
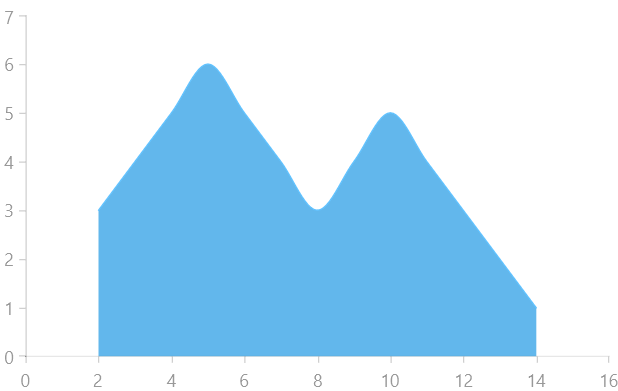
The spline-type series provides a property that allows you to control the tension of the spline. To do so, set the SplineTension property. The tension works with relative values between 0 and 1. The defualt tension is set to 0.5.
Setting the SplineTension property
<telerikChart:RadCartesianChart x:Name="radCartesianChart">
    <telerikChart:RadCartesianChart.VerticalAxis>
        <telerikChart:LinearAxis/>
    </telerikChart:RadCartesianChart.VerticalAxis>
    <telerikChart:RadCartesianChart.HorizontalAxis>
        <telerikChart:LinearAxis/>
    </telerikChart:RadCartesianChart.HorizontalAxis>

    <telerikChart:ScatterSplineAreaSeries ItemsSource="{Binding}" SplineTension="0.9">
        <telerikChart:ScatterSplineAreaSeries.XValueBinding>
            <telerikChart:PropertyNameDataPointBinding PropertyName="Category"/>
        </telerikChart:ScatterSplineAreaSeries.XValueBinding>
        <telerikChart:ScatterSplineAreaSeries.YValueBinding>
            <telerikChart:PropertyNameDataPointBinding PropertyName="Value"/>
        </telerikChart:ScatterSplineAreaSeries.YValueBinding>
    </telerikChart:ScatterSplineAreaSeries>
</telerikChart:RadCartesianChart>