Scatter Line Series
The ScatterLineSeries are represented on the chart as data points connected with straight line segments.
Properties
ScatterLineSeries class inherits from the ScatterPointSeries class - See the inherited properties.
- Stroke (Brush): Gets or sets the Brush instance that defines the stroke of the line used to present the series.
- StrokeThickness (double): Gets or sets the thickness of the line used to present the series.
Example
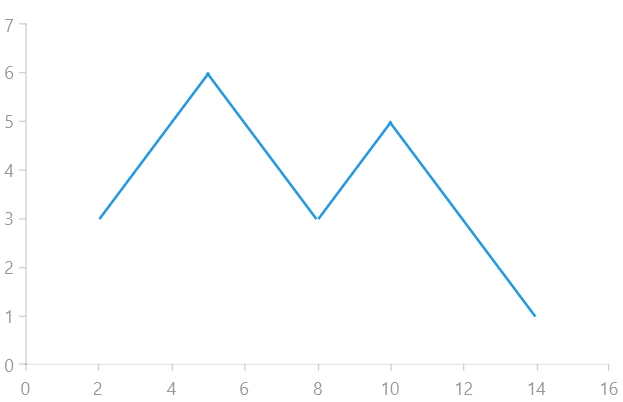
Examples 1, 2 and 3 show how to implement a RadCartesianChart with a ScatterLineSeries.
Example 1: Defining the model
public class Data
{
    public double XValue { get; set; }

    public double YValue { get; set; }
}
Example 2: Populating with data
List<Data> sampleData = new List<Data>();
sampleData.Add(new Data() { XValue = 2, YValue = 3 });
sampleData.Add(new Data() { XValue = 3, YValue = 4 });
sampleData.Add(new Data() { XValue = 4, YValue = 5 });
sampleData.Add(new Data() { XValue = 5, YValue = 6 });
sampleData.Add(new Data() { XValue = 6, YValue = 5 });
sampleData.Add(new Data() { XValue = 7, YValue = 4 });
sampleData.Add(new Data() { XValue = 8, YValue = 3 });
sampleData.Add(new Data() { XValue = 9, YValue = 4 });
sampleData.Add(new Data() { XValue = 10, YValue = 5 });
sampleData.Add(new Data() { XValue = 11, YValue = 4 });
sampleData.Add(new Data() { XValue = 12, YValue = 3 });
sampleData.Add(new Data() { XValue = 13, YValue = 2 });
sampleData.Add(new Data() { XValue = 14, YValue = 1 });

this.scatterLineSeries.DataContext = sampleData;
Example 3: Defining the RadCartesianChart and ScatterLineSeries
<Grid xmlns:telerikChart="using:Telerik.UI.Xaml.Controls.Chart">
    <telerikChart:RadCartesianChart x:Name="scatterLineSeries">
        <telerikChart:RadCartesianChart.VerticalAxis>
            <telerikChart:LinearAxis/>
        </telerikChart:RadCartesianChart.VerticalAxis>
        <telerikChart:RadCartesianChart.HorizontalAxis>
            <telerikChart:LinearAxis/>
        </telerikChart:RadCartesianChart.HorizontalAxis>

        <telerikChart:ScatterLineSeries ItemsSource="{Binding}">
            <telerikChart:ScatterLineSeries.XValueBinding>
                <telerikChart:PropertyNameDataPointBinding PropertyName="XValue"/>
            </telerikChart:ScatterLineSeries.XValueBinding>
            <telerikChart:ScatterLineSeries.YValueBinding>
                <telerikChart:PropertyNameDataPointBinding PropertyName="YValue"/>
            </telerikChart:ScatterLineSeries.YValueBinding>
        </telerikChart:ScatterLineSeries>
    </telerikChart:RadCartesianChart>
</Grid>
Figure 1: Result from Example 3