Scatter Area Series
When using ScatterAreaSeries the data points are connected with straight line segments and the area enclosed by the line and the coordinate axis may be optionally stroked and/or filled.
Properties
The ScatterAreaSeries class inherits from the ScatterLineSeries class - See the inherited properties.
-
StrokeMode: Gets or sets the mode that defines how the plot area is stroked. The available modes are:
- None: No outlining.
- LeftLine: The left border of the plot area defined by the data points and the horizontal axis is outlined.
- Points: The line that connects all points is outlined. This is the default mode.
- RightLine: The right border of the plot area defined by the data points and the horizontal axis is outlined.
- PlotLine: The bottom border of the plot area is outlined.
- LeftAndPoints: LeftLine and Points modes are enabled.
- RightAndPoints: RightLine and Points modes are enabled.
- AllButPlotLine: All modes except the PlotLine are enabled.
- All: All modes are enabled - the plot area is fully outlined.
- Fill (Brush): Gets or sets the Brush used to fill the plot area.
Example
Examples 1, 2 and 3 show how to implement a RadCartesianChart with a ScatterAreaSeries.
Example 1: Defining the model
public class Data
{
    public double Category { get; set; }

    public double Value { get; set; }
}
Example 2: Populating with data
public MainPage()
{
    this.InitializeComponent();
    List<Data> sampleData = new List<Data>();
    sampleData.Add(new Data() { Category = 2, Value = 3 });
    sampleData.Add(new Data() { Category = 3, Value = 4 });
    sampleData.Add(new Data() { Category = 4, Value = 5 });
    sampleData.Add(new Data() { Category = 5, Value = 6 });
    sampleData.Add(new Data() { Category = 6, Value = 5 });
    sampleData.Add(new Data() { Category = 7, Value = 4 });
    sampleData.Add(new Data() { Category = 8, Value = 3 });
    sampleData.Add(new Data() { Category = 9, Value = 4 });
    sampleData.Add(new Data() { Category = 10, Value = 5 });
    sampleData.Add(new Data() { Category = 11, Value = 4 });
    sampleData.Add(new Data() { Category = 12, Value = 3 });
    sampleData.Add(new Data() { Category = 13, Value = 2 });
    sampleData.Add(new Data() { Category = 14, Value = 1 });

    this.scatterAreaSeries.DataContext = sampleData;
}
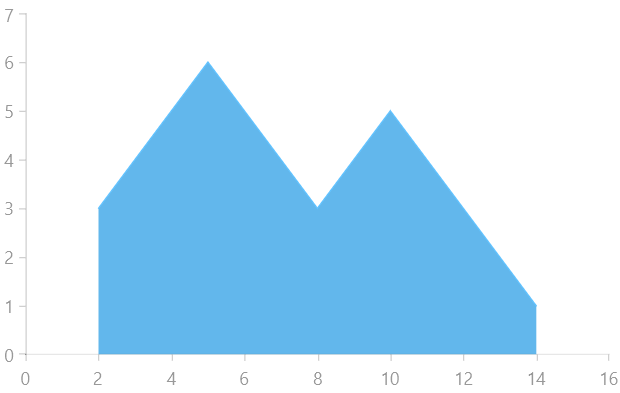
Example 3: Defining the RadCartesianChart and ScatterAreaSeries
<Grid xmlns:telerikChart="using:Telerik.UI.Xaml.Controls.Chart">
    <telerikChart:RadCartesianChart x:Name="scatterAreaSeries">
        <telerikChart:RadCartesianChart.VerticalAxis>
            <telerikChart:LinearAxis/>
        </telerikChart:RadCartesianChart.VerticalAxis>
        <telerikChart:RadCartesianChart.HorizontalAxis>
            <telerikChart:LinearAxis/>
        </telerikChart:RadCartesianChart.HorizontalAxis>

        <telerikChart:ScatterAreaSeries ItemsSource="{Binding}">
            <telerikChart:ScatterAreaSeries.XValueBinding>
                <telerikChart:PropertyNameDataPointBinding PropertyName="Category"/>
            </telerikChart:ScatterAreaSeries.XValueBinding>
            <telerikChart:ScatterAreaSeries.YValueBinding>
                <telerikChart:PropertyNameDataPointBinding PropertyName="Value"/>
            </telerikChart:ScatterAreaSeries.YValueBinding>
        </telerikChart:ScatterAreaSeries>
    </telerikChart:RadCartesianChart>
</Grid>
Figure 1: Result from Example 3