Doughnut Series
The DoughnutSeries visualizes its data points in doughnut segments.
Properties
The DoughnutSeries class inherits from the PieSeries class - See the inherited properties.
- InnerRadiusFactor (double): Gets or sets the inner radius factor of the series (that is the space that remains empty). The value is in logical units, in the range of [0, 1].
Example
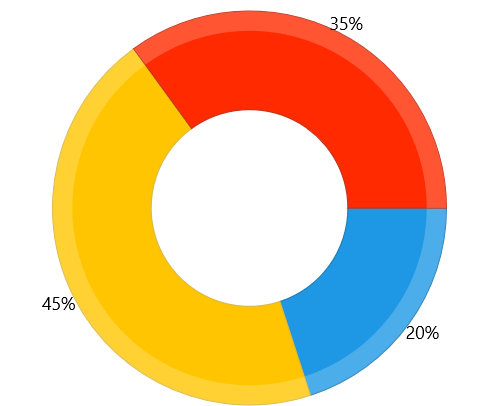
Examples 1 and 2 demonstrates how to setup a DoughnutSeries using a RadPieChart.
Example 1: Defining the model and populating with data
public sealed partial class MainPage : Page
{
    public MainPage()
    {
        this.InitializeComponent();

        this.mychart.Series[0].ItemsSource = CreateData();
    }

    public List<Data> CreateData()
    {
        List<Data> data = new List<Data>();
        data.Add(new Data() { Value = 20 });
        data.Add(new Data() { Value = 45 });
        data.Add(new Data() { Value = 35 });

        return data;
    }
}

public class Data
{
    public double Value { get; set; }
}
Example 2: Defining the DoughnutSeries
<Grid xmlns:telerikChart="using:Telerik.UI.Xaml.Controls.Chart"V>
    <telerikChart:RadPieChart x:Name="mychart" PaletteName="DefaultLight" >
        <telerikChart:DoughnutSeries ShowLabels="True">
            <telerikChart:DoughnutSeries.ValueBinding>
                <telerikChart:PropertyNameDataPointBinding PropertyName="Value"/>
            </telerikChart:DoughnutSeries.ValueBinding>
        </telerikChart:DoughnutSeries>
    </telerikChart:RadPieChart>
</Grid>
Figure 1: DoughnutSeries