Pie Series
The PieSeries class is used to visualize a single series of data in a pie chart. The sweep of a pie's slices is directly proportional to the magnitude of the data points' values.
Properties
- DataPoints: Gets the collection of data points associated with the series.
- ValueBinding: Gets or sets the binding to a property of the data model that will be used to fill the pie slices.
-
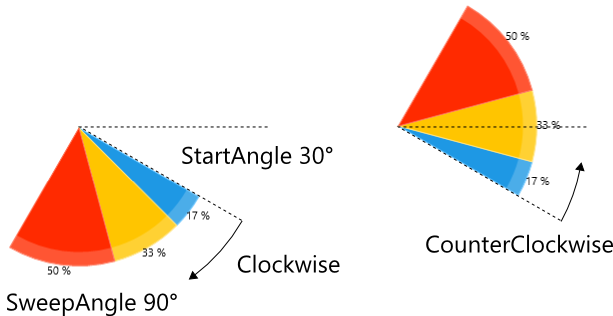
AngleRange (double startAngle, double sweepAngle, ChartSweepDirectionsweepDirection): Gets or sets the angle range in which the the pie series will be visualied.
- startAngle: The start angle for the segments.
- sweepAngle: The sweep angle in which the segments will be arranged. The value must be in the interval [-360, 360].
- sweepDirection: The direction in which the sweep angle will be measured.
HighlightBrush (Brush): Gets or sets the brush used to render the semi-filled ellipse around the series.
- DefaultSegmentStyle (Style): Gets or sets the style that defines the default appearance of each pie slice.
-
SelectedPointOffset (double): Gets or sets the offset applied to the currently selected point.
This value is applied only, if the point's OffsetFromCenter property is 0.
SegmentStyleSelector: Gets or sets the StyleSelector instance used to select the style for each PieDataPoint.
- RadiusFactor (double): Gets or sets the radius factor used to calculate the radius of the visual series. This value is usually within the (0, 1) range but it is possible to oversize the series by setting a value greater than 1.
- SegmentStyles: Gets the collection of Style instances for each segment present on the chart.
- LegendTitleBinding: Gets or sets the binding to a property from the data model that will be used by any attached legend to display the item's title.
- IsVisibleInLegendBinding: Gets or sets the binding to a property from the data model that will be used by any attached legend to specify whether to add the item in the legend.
Example
Examples 1 and 2 demonstrate how to define a PieSeries and populate it with data.
Example 1: Defining the model and populating with data
public sealed partial class MainPage : Page
{
    public MainPage()
    {
        this.InitializeComponent();

        var pieSeries = this.pieChart.Series[0];
        pieSeries.ItemsSource = CreateData();
        pieSeries.AngleRange = new AngleRange(50, 360, ChartSweepDirection.Counterclockwise);
    }

    public List<Data> CreateData()
    {
        List<Data> data = new List<Data>();
        data.Add(new Data() { Value = 20 });
        data.Add(new Data() { Value = 45 });
        data.Add(new Data() { Value = 35 });

        return data;
    }
}

public class Data
{
    public double Value { get; set; }
}
Example 2: Setting the ItemTemplate
<Grid xmlns:telerikChart="using:Telerik.UI.Xaml.Controls.Chart">
<telerikChart:RadPieChart x:Name="pieChart" PaletteName="DefaultLight" Margin="55">
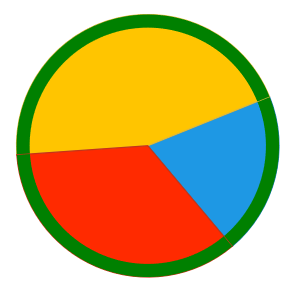
<telerikChart:PieSeries ShowLabels="False" HighlightBrush="Green" ClipToPlotArea="False">
<telerikChart:PieSeries.ValueBinding>
<telerikChart:PropertyNameDataPointBinding PropertyName="Value"/>
</telerikChart:PieSeries.ValueBinding>
</telerikChart:PieSeries>
</telerikChart:RadPieChart>
</Grid>
Figure 1: RadPieChart with PieSeries