Plot Area
The chart's plot area is the zone where all data points are drawn, excluding the axes. The API of the chart allows you to get information about the area or apply a custom style for the visual element that represents it.
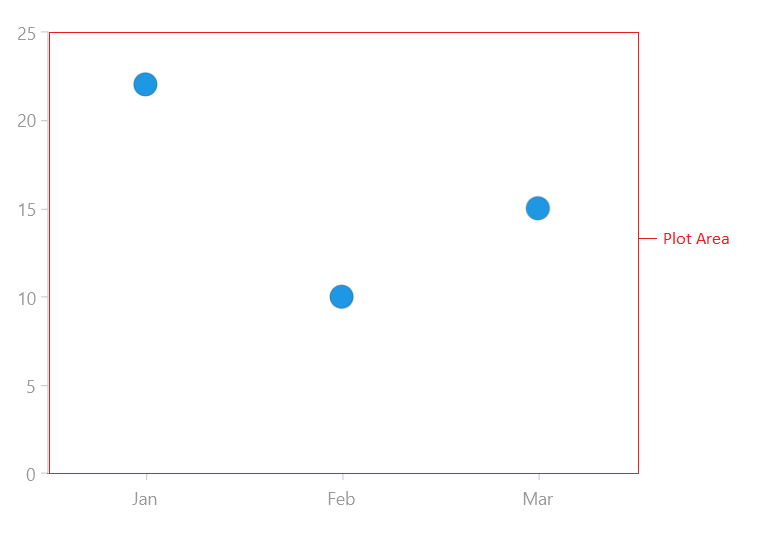
Get Plot Area Boundaries
You can get information about the plot area's boundaries via the PlotAreaClip property of the chart. The property is of type RadRect which contains the position and size of the plot area. The information provided by PlotAreaClip doesn't include the currently applied zoom factor.
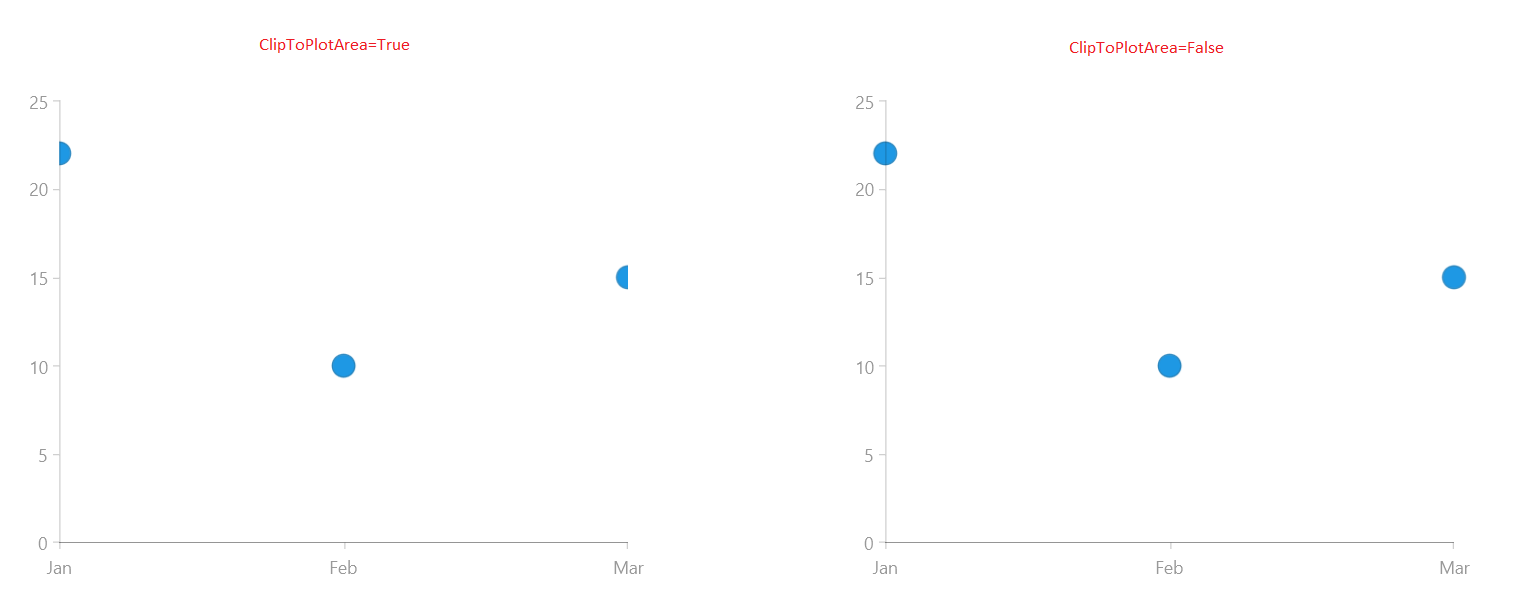
Clip to Plot Area
By default the elements presented by the chart (series and annotations) are clipped into the plot area. Anything that leaves the boundaries won't be rendered. To alter this you can use the ClipToPlotArea property that is exposed by the chart elements. Its default value is true.
Setting ClipToPlotArea of a chart series
<telerik:PointSeries ClipToPlotArea="False" />
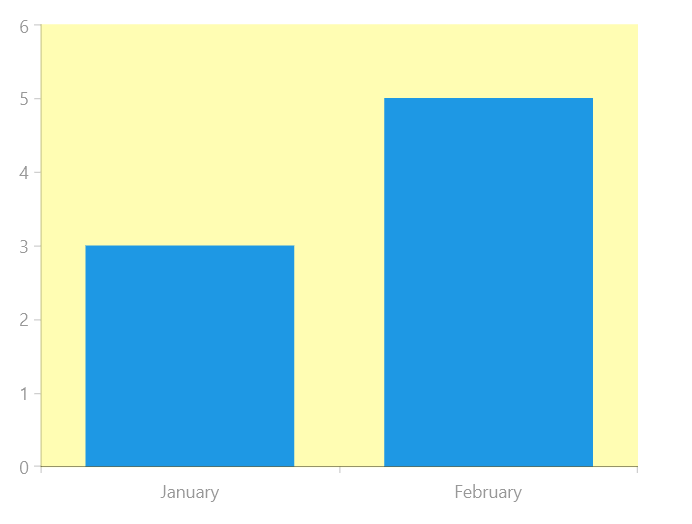
Customize the Plot Area Visual
You can customize the plot area visual via the PlotAreaStyle property of the chart. It is of type Style and the expected TargetType is Border, which is the area's visual element.
Setting PlotAreaStyle
<telerik:RadCartesianChart.PlotAreaStyle>
    <Style TargetType="Border">
        <Setter Property="Background" Value="#FFFDB3" />
    </Style>
</telerik:RadCartesianChart.PlotAreaStyle>
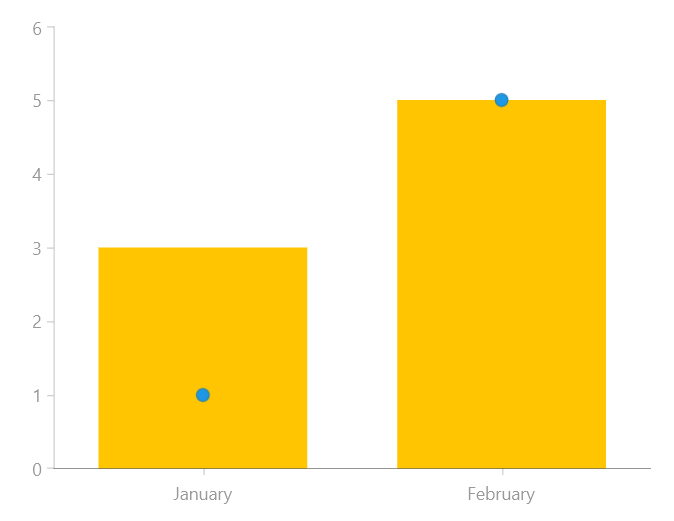
Control the Stack Order
The stack order of the elements in the chart is determined by their positions in the items collection that holds them. You can additionally control which element is displayed on top by setting the elements' ZIndex property.
Setting the ZIndex property
<telerik:RadCartesianChart x:Name="chart" Palette="Windows8">
        <telerik:RadCartesianChart.HorizontalAxis>
            <telerik:CategoricalAxis/>
        </telerik:RadCartesianChart.HorizontalAxis>

        <telerik:RadCartesianChart.VerticalAxis >
            <telerik:LinearAxis />
        </telerik:RadCartesianChart.VerticalAxis>

        <telerik:RadCartesianChart.Series>
            <telerik:LineSeries ZIndex="100">
                <telerik:LineSeries.DataPoints >
                    <telerik:CategoricalDataPoint Category="January" Value="1" />
                    <telerik:CategoricalDataPoint Category="February" Value="5" />
                </telerik:LineSeries.DataPoints>
            </telerik:LineSeries>

            <telerik:BarSeries>
                <telerik:BarSeries.DataPoints>
                    <telerik:CategoricalDataPoint Category="January" Value="3" />
                    <telerik:CategoricalDataPoint Category="February" Value="5" />
                </telerik:BarSeries.DataPoints>
            </telerik:BarSeries>
        </telerik:RadCartesianChart.Series>
    </telerik:RadCartesianChart>