Chart Types
RadChart suite provides a set of few charting components, each representing different visualization type.
The available charts are CartesianChart, PieChart and PolarChart.
Most examples in the help documentation focuses on the CartesianChart, but the other chart types support the same set of features where applicable.
Cartesian Chart
This chart type is represented by the RadCartesianChart control and it uses the Cartesian coordinate system to plot the data points. The horizontal and vertical axes define the coordinates type used to draw the data visualization (the chart series).
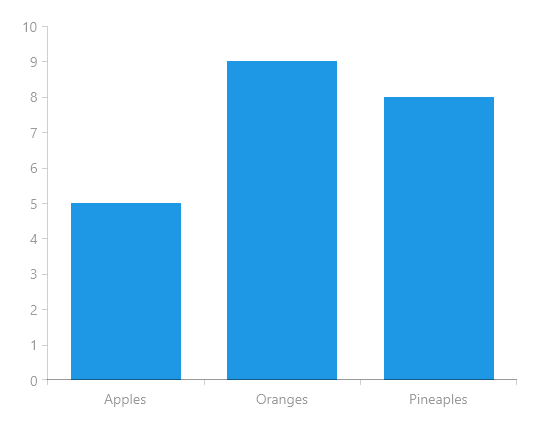
The CartesianChart supports different types of axes - categorical, numerical and date-time, along with their variations. Read more in the Axis section of the documentation.
Pie Chart
This chart type is represented by the RadPieChart control and it visualizes its data points using a discrete polar coordinate system. Each point is represented as an arc segment. The arc’s length represents the point’s value percentage of the total sum. The data visualization of the pie is drawn using the PieSeries and DoughnutSeries elements.

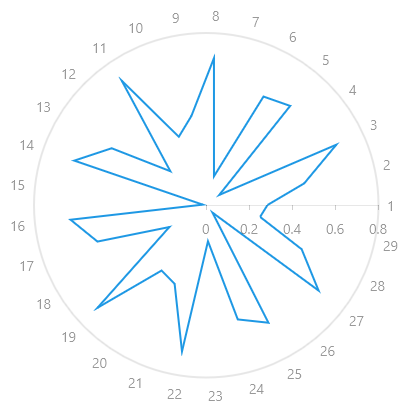
PolarChart
This chart type is represented by the RadPolarChart control and it uses a polar coordinate system to plot its data.
The polar chart supports numerical and date-time typed axes. Read more in the PolarChart section of the documentation.