CandlestickSeries
The CandlestickSeries is similar to the OhlcSeries, but instead of tick marks, it uses a rectangle which horizontal sides define the opening and closing price. The rectangle is filled, if the opening price is lower than the closing one, otherwise it's empty.
The CandlestickSeries class inherits from the OhlcSeriesBase class - See the inherited properties.
Example
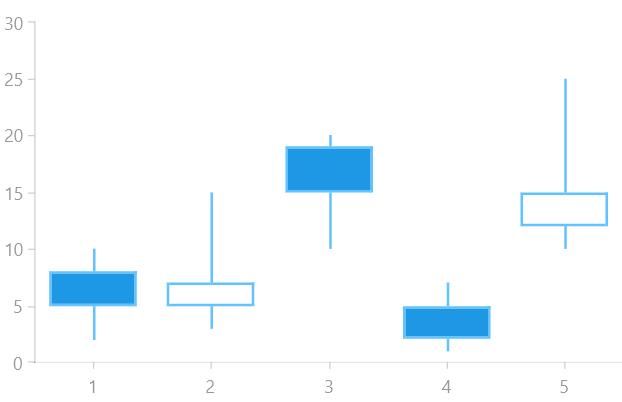
Examples 1, 2 and 3 show how to create a RadCartesianChart with a CandleStickSeries.
Example 1: Defining the model
public class FinancialData
{
    public double High { get; set; }

    public double Low { get; set; }

    public double Open { get; set; }

    public double Close { get; set; }
}
Example 2: Populating with data
public MainPage()
{
    this.InitializeComponent();
    List<FinancialData> sampleData = new List<FinancialData>();
    sampleData.Add(new FinancialData() { High = 10, Open = 5, Low = 2, Close = 8 });
    sampleData.Add(new FinancialData() { High = 15, Open = 7, Low = 3, Close = 5 });
    sampleData.Add(new FinancialData() { High = 20, Open = 15, Low = 10, Close = 19 });
    sampleData.Add(new FinancialData() { High = 7, Open = 2, Low = 1, Close = 5 });
    sampleData.Add(new FinancialData() { High = 25, Open = 15, Low = 10, Close = 12 });

    this.candlestickSeries.DataContext = sampleData;

}
Example 3: Defining the RadCartesianChart and CandlestickSeries
<Grid xmlns:telerikChart="using:Telerik.UI.Xaml.Controls.Chart">
    <telerikChart:RadCartesianChart x:Name="candlestickSeries">
        <telerikChart:RadCartesianChart.VerticalAxis>
            <telerikChart:LinearAxis/>
        </telerikChart:RadCartesianChart.VerticalAxis>
        <telerikChart:RadCartesianChart.HorizontalAxis>
            <telerikChart:CategoricalAxis/>
        </telerikChart:RadCartesianChart.HorizontalAxis>

        <telerikChart:CandlestickSeries ItemsSource="{Binding}">
            <telerikChart:CandlestickSeries.HighBinding>
                <telerikChart:PropertyNameDataPointBinding PropertyName="High"/>
            </telerikChart:CandlestickSeries.HighBinding>
            <telerikChart:CandlestickSeries.LowBinding>
                <telerikChart:PropertyNameDataPointBinding PropertyName="Low"/>
            </telerikChart:CandlestickSeries.LowBinding>
            <telerikChart:CandlestickSeries.OpenBinding>
                <telerikChart:PropertyNameDataPointBinding PropertyName="Open"/>
            </telerikChart:CandlestickSeries.OpenBinding>
            <telerikChart:CandlestickSeries.CloseBinding>
                <telerikChart:PropertyNameDataPointBinding PropertyName="Close"/>
            </telerikChart:CandlestickSeries.CloseBinding>
        </telerikChart:CandlestickSeries>
    </telerikChart:RadCartesianChart>
</Grid>
Figure 1: Result from Example 3