Reading Map Shapes
The Visualization Layer allows you to read data from several geospatial data formats and wrap it in MapShapeData objects. The currently supported formats are:
ESRI shape files.
KML files.
SQL Geospatial (WKT/WKB).
The VisualizationLayer allows asynchronous processing of the geospatial data.
This topic covers the major concepts of the geospatial data reading:
- Reading files
- Specifying a tooltip
- Clearing the layer
- Styling the shapes
Reading Files
The Visualization Layer reads map shape data using asynchronous map shape data readers:
AsyncShapeFileReader: Reads map shape geometry from the ESRI Shape file (.shp) and extended data from the data file (.dbf).
-
AsyncKmlReader: Reads map shape geometry and extended data from the KML file.
Not all KML elements are supported.
AsyncSqlGeospatialDataReader: Reads map shape geometry from the WKT/WKB representation.
The AsyncShapeFileReader and AsyncKmlReader inherit the AsyncFileReaderBase abstract class which in turn inherits the AsyncReaderBase abstract class, which is the base class for all of the readers mentioned above.
If your application loads a comparatively small number of map shape data, then you can specify the data source directly in XAML as demonstrated in Example 1.
Example 1: AsyncShapeFileReader with its source set in xaml
<dataVisualization:RadMap x:Name="radMap" ZoomLevel="1" UseSpringAnimations="False">
    <dataVisualization:RadMap.Provider>
        <telerikMap:EmptyProvider />
    </dataVisualization:RadMap.Provider>
    <telerikMap:VisualizationLayer x:Name="visualizationLayer">
        <telerikMap:VisualizationLayer.Reader>
            <telerikMap:AsyncShapeFileReader DataSource="ms-appx:///Examples/Map/Shapes/world.dbf"
                                                Source="ms-appx:///Examples/Map/Shapes/world.shp" />
        </telerikMap:VisualizationLayer.Reader>
        <telerikMap:VisualizationLayer.Colorizer>
            <telerikMap:GraphColoriser>
                <telerikMap:GraphColoriser.ShapeFillCollection>
                    <telerikMap:MapShapeFill Fill="Green" Stroke="#B1946D" StrokeThickness="1" />
                    <telerikMap:MapShapeFill Fill="Blue" Stroke="#B1946D" StrokeThickness="1" />
                    <telerikMap:MapShapeFill Fill="Yellow" Stroke="#B1946D" StrokeThickness="1" />
                    <telerikMap:MapShapeFill Fill="Orange" Stroke="#B1946D" StrokeThickness="1" />
                    <telerikMap:MapShapeFill Fill="Aqua" Stroke="#B1946D" StrokeThickness="1" />
                </telerikMap:GraphColoriser.ShapeFillCollection>
                <telerikMap:GraphColoriser.HighlightFillCollection>
                    <telerikMap:MapShapeFill Fill="Red" Stroke="#B1946D" StrokeThickness="1" />
                </telerikMap:GraphColoriser.HighlightFillCollection>
            </telerikMap:GraphColoriser>
        </telerikMap:VisualizationLayer.Colorizer>
    </telerikMap:VisualizationLayer>
</dataVisualization:RadMap>
Sometimes map shape data source can contain extremely large number of the items. In this case you can be faced with insufficient productivity of the rendering engine. If your application is intended to show large number of map shapes, we strongly recommend using items virtualization, which is available out-of-the-box in the VisualizationLayer.
AsyncReaderBase events
The events described in this section are available for the AsyncShapeFileReader, AsyncKmlReader and AsyncSqlGeospatialDataReader since they are defined in the AsyncReaderBase class which is inherited by all of them. The example in this section uses the AsyncShapeFileReader for demonstration purposes.
PreviewReadShapeDataCompleted: Occurs when the reader completes to read shapes.
ReadShapeDataCompleted: Occurs when the reader completes to read shapes and pass them to the target layer.
-
PreviewReadShapeData: Occurs each time when a shape data is read. Example 5 demonstrates how you can use the PreviewReadShapeData event in order to cancel the loading of the shapes.
Example 2: AsyncShapeFileReader with PreviewReadShapeData event
    <telerikMap:VisualizationLayer.Reader>
        <telerikMap:AsyncShapeFileReader  x:Name="reader"
                                       PreviewReadShapeData="AsyncShapeFileReader_PreviewReadShapeData"/>
    </telerikMap:VisualizationLayer.Reader>
Example 3: Cancel shape loading
private void AsyncShapeFileReader_PreviewReadShapeData(object sender, PreviewReadShapeDataCompletedEventArgs e) { if (e.Items.Count > 0) { var shape = e.Items[0]; // if(....) your condition for cancelling here this.reader.CancelAsync(); } } ProgressChanged: Occurs when part of data is read.
Specifying a tooltip
The asynchronous map shape data readers can use the Extended Data associated with map shape to display it in a tooltip for the respective shape. In order to allow you to configure the tooltip's appearance and content, the readers expose the following properties:
ToolTipFormat: Allows you to specify the format string for the tooltip. This is the simplest way to configure the tooltip, when having a one-line tooltip scenario.
ToolTipStyle: Allows you to apply a Style that targets the ToolTip control.
ToolTipTemplate: Allows you to define a DataTemplate for the tooltip. This one is used when more complex, multi-line and styled tooltip scenarios.
ToolTipFormat
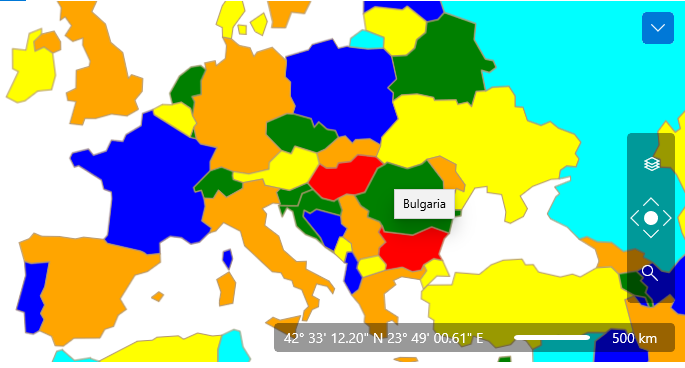
Using the ToolTipFormat property is the simplest way to create a single-line tooltip. The property is of type string and allows you to display both the value of a single property of the extended data and combination of the values of different extended data properties.
-
Single property value:
Example 6: Setting the ToolTipFormat of the AsyncShapeFileReader in xaml
    <dataVisualization:RadMap x:Name="radMap" ZoomLevel="1" UseSpringAnimations="False">
        <dataVisualization:RadMap.Provider>
            <telerikMap:EmptyProvider />
        </dataVisualization:RadMap.Provider>
        <telerikMap:VisualizationLayer x:Name="visualizationLayer">
            <telerikMap:VisualizationLayer.Reader>
                <telerikMap:AsyncShapeFileReader ToolTipFormat="CNTRY_NAME"
                                                    DataSource="ms-appx:///Examples/Map/Shapes/world.dbf"
                                                    Source="ms-appx:///Examples/Map/Shapes/world.shp" />
            </telerikMap:VisualizationLayer.Reader>
            <telerikMap:VisualizationLayer.Colorizer>
                <telerikMap:GraphColoriser>
                    <telerikMap:GraphColoriser.ShapeFillCollection>
                        <telerikMap:MapShapeFill Fill="Green" Stroke="#B1946D" StrokeThickness="1" />
                        <telerikMap:MapShapeFill Fill="Blue" Stroke="#B1946D" StrokeThickness="1" />
                        <telerikMap:MapShapeFill Fill="Yellow" Stroke="#B1946D" StrokeThickness="1" />
                        <telerikMap:MapShapeFill Fill="Orange" Stroke="#B1946D" StrokeThickness="1" />
                        <telerikMap:MapShapeFill Fill="Aqua" Stroke="#B1946D" StrokeThickness="1" />
                    </telerikMap:GraphColoriser.ShapeFillCollection>
                    <telerikMap:GraphColoriser.HighlightFillCollection>
                        <telerikMap:MapShapeFill Fill="Red" Stroke="#B1946D" StrokeThickness="1" />
                    </telerikMap:GraphColoriser.HighlightFillCollection>
                </telerikMap:GraphColoriser>
            </telerikMap:VisualizationLayer.Colorizer>
        </telerikMap:VisualizationLayer>
    </dataVisualization:RadMap>
Example 7: Setting the ToolTipFormat of the AsyncShapeFileReader in code
this.visualizationLayer.Reader.ToolTipFormat = "CNTRY_NAME";Figure 1: Result from Example 6
-
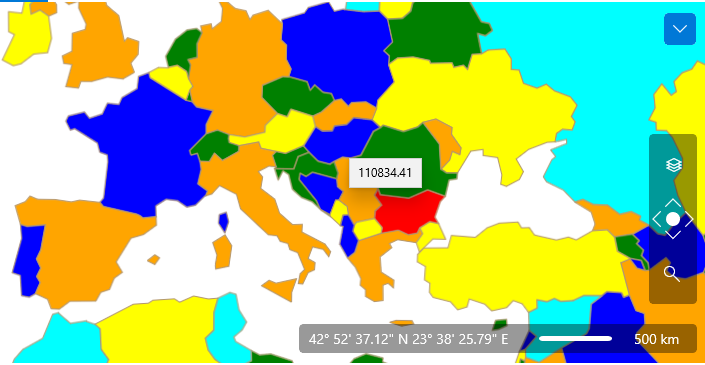
Formatted property value:
Note that in this case the format string begins with "{}". This escapes the following {PropertyName} expressions. In code behind you don't need to add it to the actual format string.
Example 8: Setting the ToolTipFormat of the AsyncShapeFileReader to a formatted property in xaml
    <telerikMap:VisualizationLayer.Reader>
        <telerikMap:AsyncShapeFileReader ToolTipFormat="{}{SQKM|F2}"
                                            DataSource="ms-appx:///Examples/Map/Shapes/world.dbf"
                                            Source="ms-appx:///Examples/Map/Shapes/world.shp" />
    </telerikMap:VisualizationLayer.Reader>
Example 9: Setting the ToolTipFormat of the AsyncShapeFileReader to a formatted property in code
this.visualizationLayer.Reader.ToolTipFormat = "{SQKM|F2}";Figure 2: Result from Example 8
-
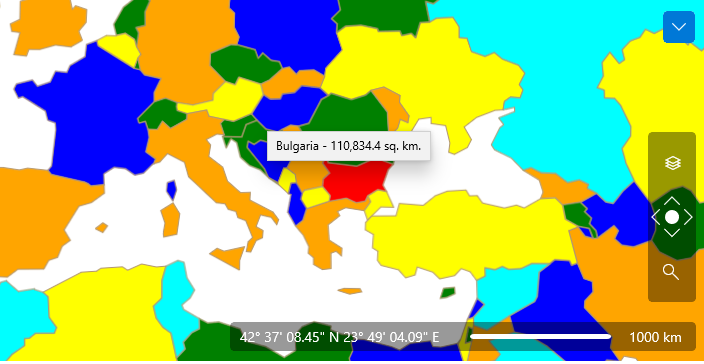
Multiple formatted property values:
Example 10: Setting the ToolTipFormat of the AsyncShapeFileReader to a complex format in xaml
    <telerikMap:VisualizationLayer.Reader>
        <telerikMap:AsyncShapeFileReader ToolTipFormat="{}{CNTRY_NAME} - {SQKM|#,#.0} sq. km."
                                            DataSource="ms-appx:///Examples/Map/Shapes/world.dbf"
                                            Source="ms-appx:///Examples/Map/Shapes/world.shp" />
    </telerikMap:VisualizationLayer.Reader>
Example 11: Setting the ToolTipFormat of the AsyncShapeFileReader to a complex format in code
this.visualizationLayer.Reader.ToolTipFormat = "{CNTRY_NAME} - {SQKM|#,#.0} sq. km.";Figure 3: Result from Example 10
ToolTipTemplate
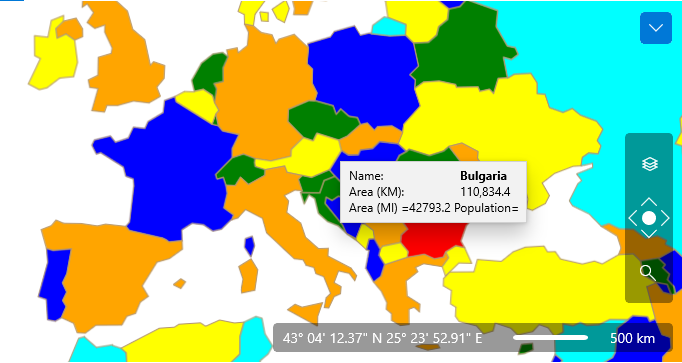
The ToolTipTemplate property allows you to define a DataTemplate for the tooltip. This way you are able to create more complex layouts like multiline content or content containing different visual elements like Borders, Images etc.
In this case the DataTemplate takes as DataContext the entire Extended Data Set. To get a specific value you have to bind to the Data property and use an indexer or converter to access the desired attribute. The RadMap provides such converter out of the box. It is represented by the ExtendedDataConverter. To use it just bind to the extended data set and pass the desired attribute name as parameter. This is demonstrated in Example 12.
The ToolTipTemplate property will take precedence over the ToolTipFormat one.
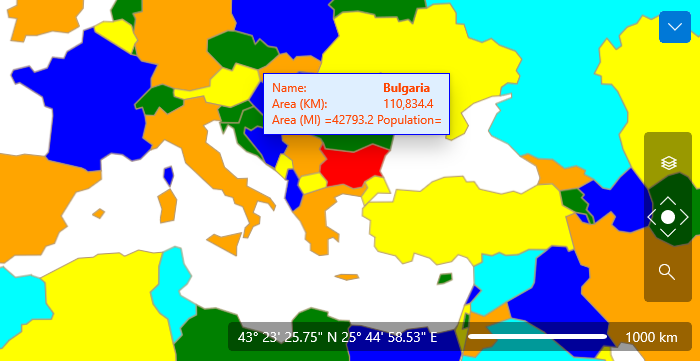
Example 12: AsyncShapeFileReader with ToolTipTemplate
    <ExamplePage.Resources>
        <telerikMap:ExtendedDataConverter x:Key="ExtendedDataConverter" />

        <DataTemplate x:Key="TooltipTemplate">
            <Grid>
                <Grid.ColumnDefinitions>
                    <ColumnDefinition Width="Auto" />
                    <ColumnDefinition Width="Auto" />
                </Grid.ColumnDefinitions>
                <Grid.RowDefinitions>
                    <RowDefinition Height="Auto" />
                    <RowDefinition Height="Auto" />
                    <RowDefinition Height="Auto" />
                </Grid.RowDefinitions>

                <TextBlock Grid.Column="0" Grid.Row="0" Text="Name:" />
                <TextBlock Grid.Column="1" Grid.Row="0"
                               FontWeight="Bold"
                               Text="{Binding Path=Data[CNTRY_NAME]}" />

                <TextBlock Grid.Column="0" Grid.Row="1" Text="Area (KM):" />
                <TextBlock Grid.Column="1" Grid.Row="1"
                               Text="{Binding Path=Data, Converter={StaticResource ExtendedDataConverter}, ConverterParameter='{SQKM|#,#.0}'}" />

                <TextBlock Grid.Column="0" Grid.Row="2" Grid.ColumnSpan="2"
                               Text="{Binding Path=Data[Area (MI) \={SQMI|F1} Population\={POP_CNTRY|F0}]}" />
            </Grid>
        </DataTemplate>
    </ExamplePage.Resources>

    <dataVisualization:RadMap x:Name="radMap" ZoomLevel="1" UseSpringAnimations="False">
        <dataVisualization:RadMap.Provider>
            <telerikMap:EmptyProvider />
        </dataVisualization:RadMap.Provider>
        <telerikMap:VisualizationLayer x:Name="visualizationLayer">
            <telerikMap:VisualizationLayer.Reader>
                        <telerikMap:AsyncShapeFileReader ToolTipTemplate="{StaticResource TooltipTemplate}"
                                                         DataSource="ms-appx:///Examples/Map/Shapes/world.dbf"
                                                         Source="ms-appx:///Examples/Map/Shapes/world.shp" />
            </telerikMap:VisualizationLayer.Reader>
            <telerikMap:VisualizationLayer.Colorizer>
                <telerikMap:GraphColoriser>
                    <telerikMap:GraphColoriser.ShapeFillCollection>
                        <telerikMap:MapShapeFill Fill="Green" Stroke="#B1946D" StrokeThickness="1" />
                        <telerikMap:MapShapeFill Fill="Blue" Stroke="#B1946D" StrokeThickness="1" />
                        <telerikMap:MapShapeFill Fill="Yellow" Stroke="#B1946D" StrokeThickness="1" />
                        <telerikMap:MapShapeFill Fill="Orange" Stroke="#B1946D" StrokeThickness="1" />
                        <telerikMap:MapShapeFill Fill="Aqua" Stroke="#B1946D" StrokeThickness="1" />
                    </telerikMap:GraphColoriser.ShapeFillCollection>
                    <telerikMap:GraphColoriser.HighlightFillCollection>
                        <telerikMap:MapShapeFill Fill="Red" Stroke="#B1946D" StrokeThickness="1" />
                    </telerikMap:GraphColoriser.HighlightFillCollection>
                </telerikMap:GraphColoriser>
            </telerikMap:VisualizationLayer.Colorizer>
        </telerikMap:VisualizationLayer>
    </dataVisualization:RadMap>
Figure 4: Result from Example 12
ToolTipStyle
The ToolTipStyle property allows you to specify a Style of the tooltip that gets displayed. The Style should target the ToolTip control.
Example 13: AsyncShapeFileReader with ToolTipTemplate and ToolTipStyle
. . . . . . .
<Style x:Key="ShapeTooltipStyle" TargetType="ToolTip">
    <Setter Property="BorderBrush"
            Value="Blue" />
    <Setter Property="Background"
            Value="#FFDFEFFF" />
    <Setter Property="Foreground"
            Value="OrangeRed" />
</Style>
. . . . . .
<telerikMap:AsyncShapeFileReader DataSource="ms-appx:///Examples/Map/Shapes/world.dbf"
                             Source="ms-appx:///Examples/Map/Shapes/world.shp"
                              ToolTipTemplate="{StaticResource TooltipTemplate}"
                              ToolTipStyle="{StaticResource ShapeTooltipStyle}">
</telerikMap:AsyncShapeFileReader>
. . . . . .
</UserControl>
Figure 5: Result from Example 13
Reading multiple files
There are many scenarios when it is necessary to read multiple shape files into one layer. The AsyncShapeFileReader and AsyncKmlReader have an ability to specify several sources to read in one process. To specify every single file to read you should use AsyncReaderSourceobject as demonstrated in Example 14.
Example 14: Reading multiple shape files with AsyncShapeFileReader in xaml
<dataVisualization:RadMap x:Name="radMap"
                ZoomLevel="6"
                Center="37, -120">
    <dataVisualization:RadMap.Provider>
        <telerikMap:EmptyProvider />
    </dataVisualization:RadMap.Provider>
    <telerikMap:VisualizationLayer x:Name="visualizationLayer">
        <telerikMap:VisualizationLayer.ShapeFill>
            <telerikMap:MapShapeFill Fill="#6FDFEFFF"
                                  Stroke="Blue"
                                  StrokeThickness="2" />
        </telerikMap:VisualizationLayer.ShapeFill>
        <telerikMap:VisualizationLayer.Reader>
            <telerikMap:AsyncShapeFileReader x:Name="mapShapeDataReader">
                <telerikMap:AsyncReaderSource Source="ms-appx:///Examples/Map/Shapes/Hotel_base.shp" />
                <telerikMap:AsyncReaderSource Source="ms-appx:///Examples/Map/Shapes/Hotel_Corridors.shp" />
                <telerikMap:AsyncReaderSource Source="ms-appx:///Examples/Map/Shapes/Hotel_ServiceRooms.shp" />
                <telerikMap:AsyncReaderSource Source="ms-appx:///Examples/Map/Shapes/Hotel_LiftsAndLadders.shp" />
                <telerikMap:AsyncReaderSource Source="ms-appx:///Examples/Map/Shapes/Hotel_Rooms.shp" />
            </telerikMap:AsyncShapeFileReader>
        </telerikMap:VisualizationLayer.Reader>
    </telerikMap:VisualizationLayer>
</dataVisualization:RadMap>
Clearing the Layer
When adding the read shapes to the layer, the reader is able to clear it first. This means that all previously added shapes will get removed and the new ones will be added. This behavior is controlled by the ClearLayer property of the reader. Its default value is “True”. This means that the described behavior will be active by default. To disable it set the property to “False”.
Styling the Shapes
To modify the appearance of the shapes in terms of Fill, Stroke etc. You can either use the HighlightFill, ShapeFill or SelectedFill properties of the VisualizationLayer or use the Colorizer property of the VisualizationLayer.