Map Shape Data
The visualization engine based on the VisualizationLayer class introduces a approach that separates the geographical data and its visualization. The map shape data classes are not dependency objects. This allows them to be created in the background thread. The unified map shape visualization engine allows attaching to any input event supported by the ContentPresenter class to the map shape visual presentation.
You will be able to find equivalents to most of the Shapes available in WPF/Silverlight.
To learn more about the different ways of customizing the shape apperance, please check the Shape Appearance topic.
The map shape data can be used identically to their visual element counterparts. This topic will focus briefly on showing you how to use the most important of them:
- EllipseData
- LineData
- PathData
- PolygonData
- PolylineData
- RectangleData
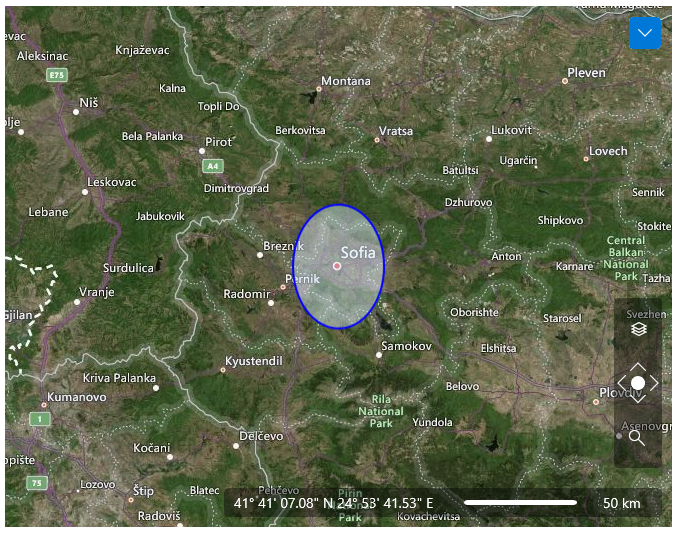
EllipseData
The Width and Height of the EllipseData are given in the spatial reference units (degrees by default) instead of current distance unit (mile or kilometer).
To use the EllipseData in your visualization layer you have to set the following of its properties:
Location: Represents the location on the map on which the ellipse will be displayed.
Width / Height: Represent the width / height of the ellipse in spatial reference units (degrees by default).
Note that the top left corner coincides with the given location.
Here it is an example:
Example 1
<dataVisualization:RadMap x:Name="radMap"
        Zoom="8"
        Center="42.6957539183824, 23.3327663758679">
    <dataVisualization:RadMap.Provider>
        <telerikMap:OpenStreetMapProvider APIKey="Your API Key" StandardModeUserAgent="Your User Agent"/>
    </dataVisualization:RadMap.Provider>
    <telerikMap:VisualizationLayer x:Name="visualizationLayer">
        <telerikMap:EllipseData Location="42.9457539183824,23.0827663758679"
                        Height="0.5"
                        Width="0.5">
            <telerikMap:EllipseData.ShapeFill>
                <telerikMap:MapShapeFill Fill="#6FDFEFFF"
                                Stroke="Blue"
                                StrokeThickness="2" />
            </telerikMap:EllipseData.ShapeFill>
        </telerikMap:EllipseData>
    </telerikMap:VisualizationLayer>
</dataVisualization:RadMap>
Example 2
EllipseData ellipse = new EllipseData()
{
    Location = new Location(43.4457539183824, 23.2927663758679),
    Height = 0.5,
    Width = 0.5,
    ShapeFill = new MapShapeFill()
    {
        Fill = new SolidColorBrush(Color.FromArgb(127, 0, 240, 255)),
        Stroke = new SolidColorBrush(Colors.Red),
        StrokeThickness = 2
    }
};

this.visualizationLayer.Items.Add(ellipse);
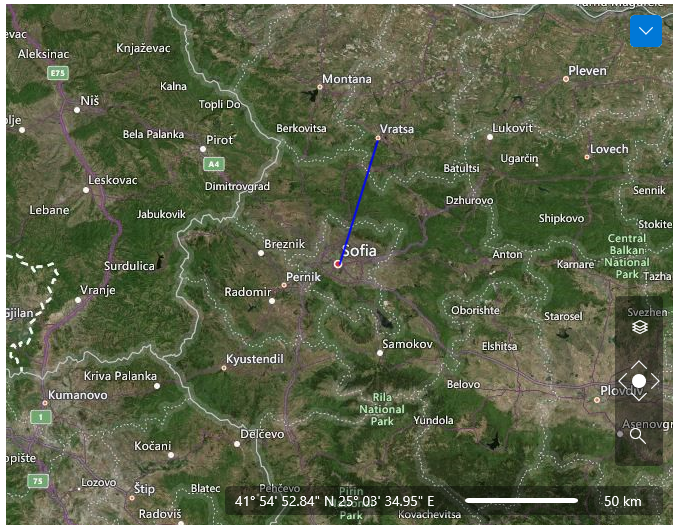
LineData
The most important properties of the LineData class are the Point1 and Point2 properties, which are of type Location. They define the start and the end points of the line. Here is an example:
Example 3
<dataVisualization:RadMap x:Name="radMap"
        Zoom="8"
        Center="42.6957539183824, 23.3327663758679">
    <dataVisualization:RadMap.Provider>
        <telerikMap:OpenStreetMapProvider APIKey="Your API Key" StandardModeUserAgent="Your User Agent"/>
    </dataVisualization:RadMap.Provider>
    <telerikMap:VisualizationLayer x:Name="visualizationLayer">
        <telerikMap:LineData Point1="42.6957539183824,23.3327663758679"
                      Point2="43.1957539183824,23.5427663758679">
            <telerikMap:LineData.ShapeFill>
                <telerikMap:MapShapeFill Stroke="Blue"
                                  StrokeThickness="2" />
            </telerikMap:LineData.ShapeFill>
        </telerikMap:LineData>
    </telerikMap:VisualizationLayer>
</dataVisualization:RadMap>
Example 4
LineData line = new LineData()
{
    Point1 = new Location(42.6957539183824, 23.3327663758679),
    Point2 = new Location(42.1429369264591, 24.7498095849434),
    ShapeFill = new MapShapeFill()
    {
        Stroke = new SolidColorBrush(Colors.Red),
        StrokeThickness = 2
    }
};

this.visualizationLayer.Items.Add(line);
PathData
The PathData provides equivalents of the standard Geometry and Segment classes in WPF/Silverlight. Here is an example that uses LineSegmentData:
Example 4
<dataVisualization:RadMap x:Name="radMap"
        Zoom="8"
        Center="42.6957539183824, 23.3327663758679">
    <dataVisualization:RadMap.Provider>
        <telerikMap:OpenStreetMapProvider APIKey="Your API Key" StandardModeUserAgent="Your User Agent"/>
    </dataVisualization:RadMap.Provider>
    <telerikMap:VisualizationLayer x:Name="visualizationLayer">
        <telerikMap:PathData>
            <telerikMap:PathData.Data>
                <telerikMap:PathGeometryData>
                    <telerikMap:PathGeometryData.Figures>
                        <telerikMap:PathFigureData IsClosed="True"
                                            StartPoint="42.6957539183824, 23.3327663758679">
                            <telerikMap:PathFigureData.Segments>
                                <telerikMap:LineSegmentData Point="42.1429369264591, 24.7498095849434" />
                                <telerikMap:LineSegmentData Point="42.5131732087098, 27.4611884843576" />
                                <telerikMap:LineSegmentData Point="43.2073941930888, 27.9275176988258" />
                                <telerikMap:LineSegmentData Point="43.1957539183824,23.5427663758679" />
                            </telerikMap:PathFigureData.Segments>
                        </telerikMap:PathFigureData>
                        <telerikMap:PathFigureData IsClosed="True"
                                            StartPoint="42.6957539183824, 23.8327663758679">
                            <telerikMap:PathFigureData.Segments>
                                <telerikMap:LineSegmentData Point="42.3429369264591, 24.7498095849434" />
                                <telerikMap:LineSegmentData Point="42.6131732087098, 26.9611884843576" />
                                <telerikMap:LineSegmentData Point="43.0073941930888, 27.3275176988258" />
                                <telerikMap:LineSegmentData Point="42.9957539183824, 23.9427663758679" />
                            </telerikMap:PathFigureData.Segments>
                        </telerikMap:PathFigureData>
                    </telerikMap:PathGeometryData.Figures>
                </telerikMap:PathGeometryData>
            </telerikMap:PathData.Data>
            <telerikMap:PathData.ShapeFill>
                <telerikMap:MapShapeFill Fill="#6FDFEFFF"
                                  Stroke="Blue"
                                  StrokeThickness="2" />
            </telerikMap:PathData.ShapeFill>
        </telerikMap:PathData>
    </telerikMap:VisualizationLayer>
</dataVisualization:RadMap>
Example 5
PathData path = new PathData()
{
    ShapeFill = new MapShapeFill()
    {
        Fill = new SolidColorBrush(Color.FromArgb(127, 0, 240, 255)),
        Stroke = new SolidColorBrush(Colors.Red),
        StrokeThickness = 2
    }
};

PathGeometryData geometry = new PathGeometryData();

PathFigureData figure = new PathFigureData()
{
    IsClosed = true,
    StartPoint = new Location(44.6957539183824, 23.3327663758679)
};

LineSegmentData segment = new LineSegmentData()
{
    Point = new Location(44.1429369264591, 24.7498095849434)
};
figure.Segments.Add(segment);

segment = new LineSegmentData()
{
    Point = new Location(44.5131732087098, 27.4611884843576)
};
figure.Segments.Add(segment);

segment = new LineSegmentData()
{
    Point = new Location(45.2073941930888, 27.9275176988258)
};
figure.Segments.Add(segment);

segment = new LineSegmentData()
{
    Point = new Location(45.1957539183824,23.5427663758679)
};
figure.Segments.Add(segment);

geometry.Figures.Add(figure);
path.Data = geometry;

this.visualizationLayer.Items.Add(path);
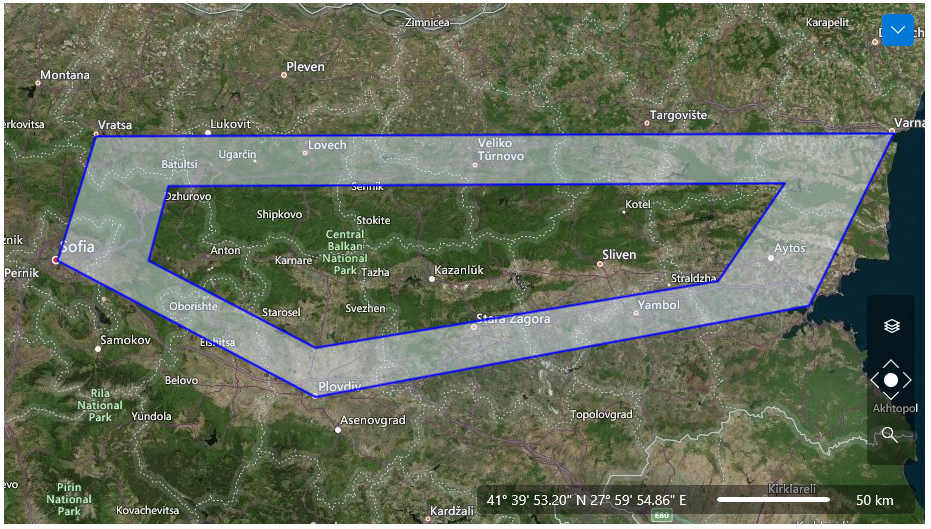
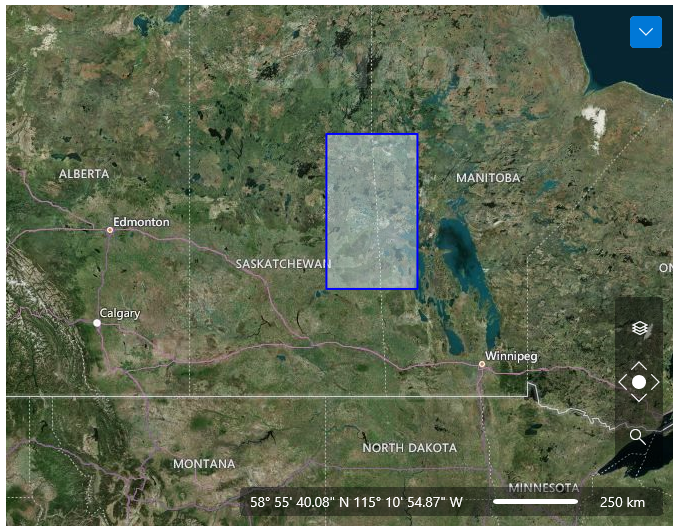
PolygonData
The difference between the standard Polygon and the PolygonData is that the Points property of the PolygonData is a set of Locations. Here is an example:
Example 6
<dataVisualization:RadMap x:Name="radMap"
        Zoom="8"
        Center="42.6957539183824, 23.3327663758679">
    <dataVisualization:RadMap.Provider>
        <telerikMap:OpenStreetMapProvider APIKey="Your API Key" StandardModeUserAgent="Your User Agent"/>
    </dataVisualization:RadMap.Provider>
    <telerikMap:VisualizationLayer x:Name="visualizationLayer">
        <telerikMap:PolygonData Points="56,-100 56,-104 52,-104 52,-100">
            <telerikMap:PolygonData.ShapeFill>
                <telerikMap:MapShapeFill Fill="#6FDFEFFF"
                                  Stroke="Blue"
                                  StrokeThickness="2" />
            </telerikMap:PolygonData.ShapeFill>
        </telerikMap:PolygonData>
    </telerikMap:VisualizationLayer>
</dataVisualization:RadMap>
Example 7
PolygonData polygon = new PolygonData()
{
    ShapeFill = new MapShapeFill()
    {
        Fill = new SolidColorBrush(Color.FromArgb(127, 0, 240, 255)),
        Stroke = new SolidColorBrush(Colors.Red),
        StrokeThickness = 2
    }
};

LocationCollection points = new LocationCollection();
points.Add(new Location(48,-104));
points.Add(new Location(48,-108));
points.Add(new Location(52,-108));
points.Add(new Location(52, -104));

polygon.Points = points;

this.visualizationLayer.Items.Add(polygon);
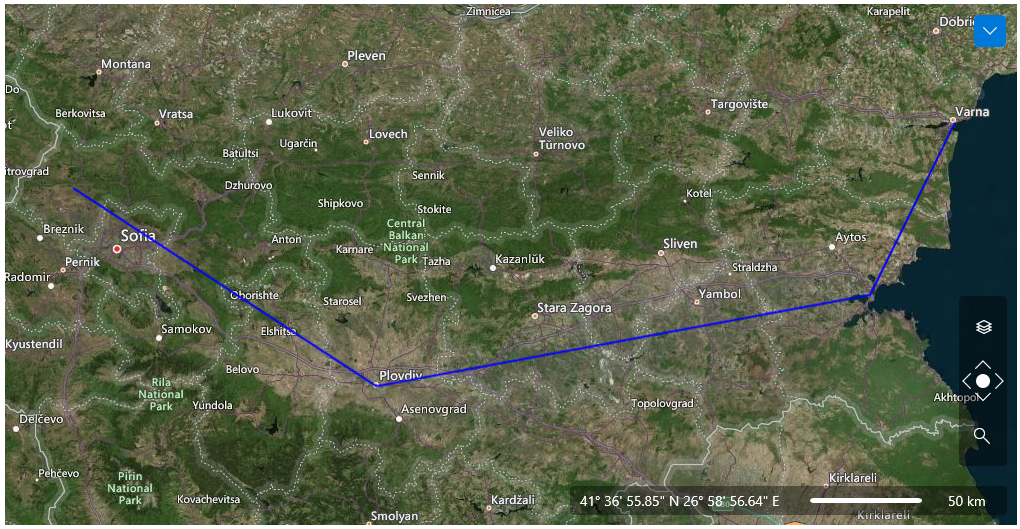
PolylineData
The difference between the standard Polyline and the PolylineData is that the Points property of the PolylineData is a set of Locations. Here is an example:
Example 8
<dataVisualization:RadMap x:Name="radMap"
        Zoom="8"
        Center="42.6957539183824, 23.3327663758679">
    <dataVisualization:RadMap.Provider>
        <telerikMap:OpenStreetMapProvider APIKey="Your API Key" StandardModeUserAgent="Your User Agent"/>
    </dataVisualization:RadMap.Provider>
    <telerikMap:VisualizationLayer x:Name="visualizationLayer">
        <telerikMap:PolylineData Points="42.945,23.082 42.142, 24.749 42.513, 27.461 43.207, 27.927">
            <telerikMap:PolylineData.ShapeFill>
                <telerikMap:MapShapeFill Stroke="Blue"
                                  StrokeThickness="2" />
            </telerikMap:PolylineData.ShapeFill>
        </telerikMap:PolylineData>
    </telerikMap:VisualizationLayer>
</dataVisualization:RadMap>
Example 9
PolylineData polyline = new PolylineData()
{
    ShapeFill = new MapShapeFill()
    {
        Stroke = new SolidColorBrush(Colors.Red),
        StrokeThickness = 2
    }
};

LocationCollection points = new LocationCollection();
points.Add(new Location(44.6957539183824, 23.3327663758679));
points.Add(new Location(44.1429369264591, 24.7498095849434));
points.Add(new Location(44.5131732087098, 27.4611884843576));
points.Add(new Location(45.2073941930888, 27.9275176988258));

polyline.Points = points;

this.visualizationLayer.Items.Add(polyline);
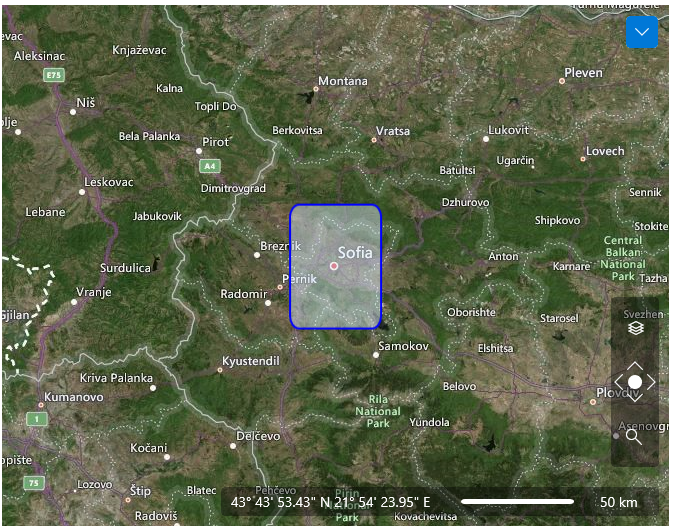
RectangleData
To use the RectangleData in your visualization layer you have to set the following properties:
Location - represents the location on the map, to which the ellipse is bound.
Width / Height: Represent the width / height of the ellipse. Just like the Width and Height properties of the EllipseData class, they are specified in spatial reference units (degrees by default).
RadiusX / RadiusY: Represent the radius of the rectangle corners. Measured in spatial reference units.
Note that the top left corner coincides with the given location.
Here it is an example:
Example 10
<dataVisualization:RadMap x:Name="radMap"
        Zoom="8"
        Center="42.6957539183824, 23.3327663758679">
    <dataVisualization:RadMap.Provider>
        <telerikMap:OpenStreetMapProvider APIKey="Your API Key" StandardModeUserAgent="Your User Agent"/>
    </dataVisualization:RadMap.Provider>
    <telerikMap:VisualizationLayer x:Name="visualizationLayer">
        <telerikMap:RectangleData Location="42.9457539183824,23.0827663758679"
                           Height="0.5"
                           Width="0.5"
                           RadiusX="0.05"
                           RadiusY="0.05">
            <telerikMap:RectangleData.ShapeFill>
                <telerikMap:MapShapeFill Fill="#6FDFEFFF"
                                  Stroke="Blue"
                                  StrokeThickness="2" />
            </telerikMap:RectangleData.ShapeFill>
        </telerikMap:RectangleData>
    </telerikMap:VisualizationLayer>
</dataVisualization:RadMap>
Example 11
RectangleData rect = new RectangleData()
{
    Location = new Location(43.4457539183824, 23.2927663758679),
    Height = 0.5,
    Width = 0.5,
    RadiusX = 0.05,
    RadiusY = 0.05,
    ShapeFill = new MapShapeFill()
    {
        Fill = new SolidColorBrush(Color.FromArgb(127, 0, 240, 255)),
        Stroke = new SolidColorBrush(Colors.Red),
        StrokeThickness = 2
    }
};

this.visualizationLayer.Items.Add(rect);