Shape Appearance
When using map shape data objects (EllipseData, LineData, PathData and so on) there are 2 ways to control their appearance:
- Using the MapShapeFill object on shape level.
- Using the MapShapeFill object on layer level.
Using the MapShapeFill object on shape level
The map shape data objects expose three specific properties: ShapeFill, HightlightFill and SelectedFill.
The first one is applied to the shapes, when they are in their normal state. The HighlightFill gets applied when the shape is highlighted. The SelectedFill gets applied when the shape is selected. You can apply regular, highlight or selected filling using UseRegularFill(), UseHighlightFill() and UseSelectedFill() methods of the map shape data object.
The three properties are of type MapShapeFill. The MapShapeFill object allows you not only to specify the Fill color, but also to modify the stroke as well.
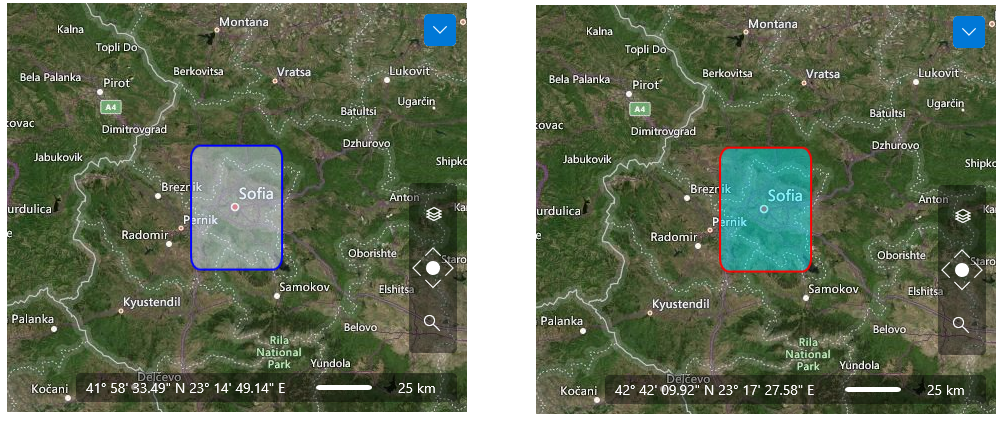
Example 1
<dataVisualization:RadMap x:Name="radMap"
                        Zoom="8"
                        Center="42.6957539183824, 23.3327663758679">
    <dataVisualization:RadMap.Provider>
        <telerikMap:OpenStreetMapProvider APIKey="Your API Key" StandardModeUserAgent="Your User Agent"/>
    </dataVisualization:RadMap.Provider>
    <telerikMap:VisualizationLayer x:Name="visualizationLayer">
        <telerikMap:RectangleData Location="42.9457539183824,23.0827663758679"
                           Height="0.5"
                           Width="0.5"
                           RadiusX="0.05"
                           RadiusY="0.05">
            <telerikMap:RectangleData.ShapeFill>
                <telerikMap:MapShapeFill Fill="#6FDFEFFF"
                                  Stroke="Blue"
                                  StrokeThickness="2" />
            </telerikMap:RectangleData.ShapeFill>
        </telerikMap:RectangleData>
    </telerikMap:VisualizationLayer>
</dataVisualization:RadMap>
Using the MapShapeFill object on layer level
You are also able to define the appearance of the shapes on the Visualization Layer level. This way every shape, that doesn't have its respective properties explicitly set, will inherit the appearance specified for the layer. For this purpose use the ShapeFill, HighlightFill and SelectedFill properties of the VisualizationLayer class. The first one is applied to the shapes, when they are in their normal state. The HighlightFill gets applied when the shape is highlighted.The SelectedFill gets applied when the shape is selected.
These values will get applied also on the shapes that are created from KML, ESRI Shapefile or WKT/WKB data and don’t have their appearance explicitly set.
The three properties are of type MapShapeFill. The MapShapeFill object allows you not only to specify the Fill color, but to modify the stroke as well.
Here is an example:
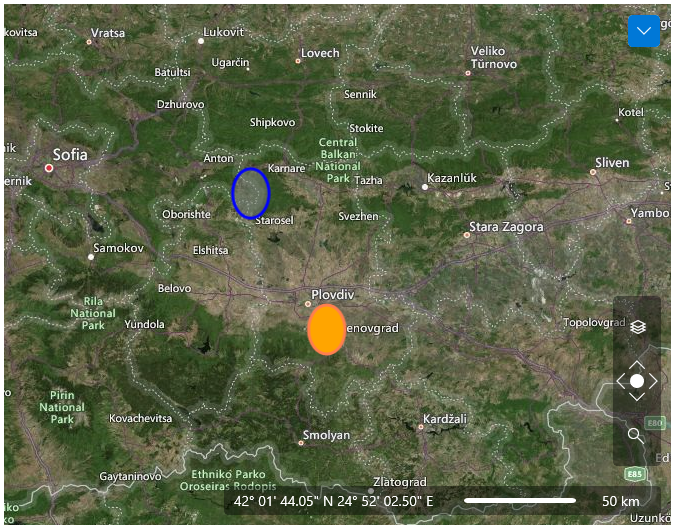
Example 3
<dataVisualization:RadMap x:Name="radMap"
                            Zoom="8"
                            Center="42.6957539183824, 23.3327663758679">
    <dataVisualization:RadMap.Provider>
        <telerikMap:OpenStreetMapProvider APIKey="Your API Key" StandardModeUserAgent="Your User Agent"/>
    </dataVisualization:RadMap.Provider>
    <telerikMap:VisualizationLayer x:Name="visualizationLayer">
        <telerikMap:VisualizationLayer.HighlightFill>
                <telerikMap:MapShapeFill Fill="Orange"
                                  Stroke="Coral"
                                  StrokeThickness="3" />
        </telerikMap:VisualizationLayer.HighlightFill>
        <telerikMap:RectangleData Location="42.9457539183824,23.0827663758679"
                        Height="0.5"
                        Width="0.5"
                        RadiusX="0.05"
                        RadiusY="0.05">
            <telerikMap:RectangleData.ShapeFill>
                <telerikMap:MapShapeFill Fill="#6FDFEFFF"
                                Stroke="Blue"
                                StrokeThickness="2" />
            </telerikMap:RectangleData.ShapeFill>
            <telerikMap:RectangleData.HighlightFill>
                <telerikMap:MapShapeFill Fill="#6F00EFFF"
                                Stroke="Red"
                                StrokeThickness="2" />
            </telerikMap:RectangleData.HighlightFill>
        </telerikMap:RectangleData>
    </telerikMap:VisualizationLayer>
</dataVisualization:RadMap>
Using the AutoHighlightMapShape property
The VisualizationLayer can highlight a map shape automatically when the mouse pointer is over it and set regular shape fill back when mouse pointer leaves the shape. You can turn on/off this feature using AutoHighlightMapShape property of the VisualizationLayer.