Introduction
The VisualizationLayer allows you to display additional data on top of the displayed map. This data can be in the form of simple framework elements, pin points or map shapes. The VisualizationLayer works like the ItemsControl class so you are able to display multiple items in a single VisualizationLayer. You can even data bind the VisualizationLayer to a collection of the geographically positioned data.
The VisualizationLayer provides several numerous and enhancements over the previously available layer:
Telerik UI for WinUI is a
professional grade UI component library for building modern and feature-rich applications. To try it out sign up for a free 30-day trial.
![]()
New to Telerik UI for WinUI?
Improved overall performance of the visualization engine. More data points and map shapes can be used at the same time.
Implemented asynchronous map shape readers for ESRI shape files, KML files and WKT/WKB formats (SQL Geospatial).
The visualization layer is not geographically limited i.e. it covers the whole map surface. It speeds up initial items loading and adding of the items dynamically.Especially with collections with large number of items.
Integrated support for the items clustering.
Integrated support for the items virtualization. You need not to use Dynamic Layer or Virtualization Layer to load and display items when they are needed. The Visualization Layer supports this functionality “out of the box”.
Items virtualization can be used in conjunction with items clustering without any additional efforts.
New hierarchy of the map shape classes. The new map shapes aren’t visual elements but clean data elements. This allows map shapes to be created in a background thread.
You can attach any event supported by ContentPresenter to the map shape object (supported in the code-behind only).
Item Types
The VisualizationLayer allows you to display the following items:
FrameworkElements: This means that you can display anything (charts, images, etc.) by wrapping it inside a framework element.
Map shapes his is a set of map shape data objects, created for usage with the RadMap. Among them you will find equivalents of the standard shape controls like Line, Rectangle, Ellipse, Polyline, Polygon and Path. Pay attention, the old map shapes (i.e. subclasses of the MapShape class) aren’t supported by VisualizationLayer. The new classes inherited from the MapShapeData object must be used.
Pin points: The MapPinPoint object is usually used to display points from a KML file, but can be also used on its own.
Adding and positioning a framework element
In order to add any framework element to the Visualization Layer you have to put it inside the VisualizationLayer's tag and set its geographical location. This is done by passing a Location object to the MapLayer.Location attached property that contains the longitude and the latitude of the position to the element. Here is an example:
Example 1
<dataVisualization:RadMap x:Name="radMap">
    <dataVisualization:RadMap.Provider>
        <telerikMap:OpenStreetMapProvider APIKey="Your API Key" StandardModeUserAgent="Your User Agent"/>
    </dataVisualization:RadMap.Provider>
    <telerikMap:VisualizationLayer x:Name="visualizationLayer">
        <Ellipse x:Name="Ellipse"
                telerikMap:MapLayer.Location="42.6957539183824, 23.3327663758679"
                Width="20"
                Height="20"
                Stroke="Red"
                StrokeThickness="3"
                Fill="Transparent" />
    </telerikMap:VisualizationLayer>
</dataVisualization:RadMap>
Additionally you can use these two attached properties provided by the MapLayer class:
BaseZoomLevel: Represents the zoom level, for which the element should have its scale transformation equal to 1.
ZoomRange: Represents the range of zoom levels for which the element should be visible.
MinScale: Represents minimum scale factor which will be applied to the framework element when it has BaseZoomLevel property set and we zoom out map control.
MaxScale: Represents maximum scale factor which will be applied to the framework element when it has BaseZoomLevel property set and we zoom in map control.
If you are using a more complex composition of UI Elements, these properties should be set to the one that represents the root. For example, if you have a Grid, which layouts an Ellipse and a TextBlock, you have to set the attached properties to the Grid.
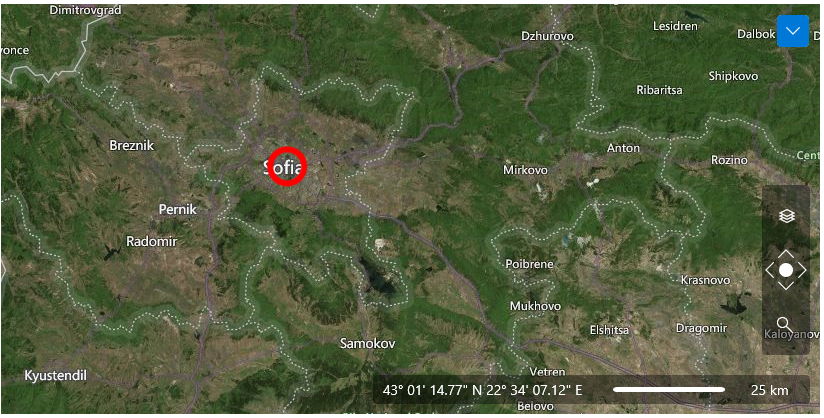
Here is an example for an Ellipse, positioned above Sofia, Bulgaria and visible only when the zoom level is grater or equal to 5 and less or equal to 12. The Ellipse will also have its normal size (100%) when the zoom level is 8. The maximum scale factor for the element is set to 8:
Example 1
<dataVisualization:RadMap x:Name="radMap"
                            ZoomLevel="8"
                            Center="42.6957539183824, 23.3327663758679">
    <dataVisualization:RadMap.Provider>
        <telerikMap:OpenStreetMapProvider APIKey="Your API Key" StandardModeUserAgent="Your User Agent"/>
    </dataVisualization:RadMap.Provider>
    <telerikMap:VisualizationLayer x:Name="visualizationLayer">
        <Ellipse x:Name="Ellipse"
            telerikMap:MapLayer.Location="42.6957539183824, 23.3327663758679"
            telerikMap:MapLayer.BaseZoomLevel="8"
            telerikMap:MapLayer.ZoomRange="5,12"
            telerikMap:MapLayer.MaxScale="8"
            HorizontalAlignment="Center"
            VerticalAlignment="Center"
            Width="20"
            Height="20"
            Stroke="Red"
            StrokeThickness="3"
            Fill="Transparent" />
    </telerikMap:VisualizationLayer>
</dataVisualization:RadMap>
Binding Items
The VisualizationLayer simulates functionality of the ItemsControl, so it's able to display not only statically defined items, but also dynamic collections of data. To do this you have to simply use its ItemsSource and ItemTemplate properties. If you want to learn more and to see an example, please read the Data Binding topic.
By using the VisualizationLayer to display your collection of data, you have to provide the entire data to it. Assuming that your data comes from a service or/and contains a lot of entries, you might want to have a data virtualization. The VisualizationLayer control supports this scenario. It can request data upon region or zoom level change. To learn more and how to use it, please read the Items Virtualization article.