Overview
The data visualization in RadChart is done by a hierarchy of classes that inherit from the ChartSeries class. Each series has a collection of data points, that is the view model of the data. A series may have its data populated by data-binding to an arbitrary IEnumerable instance through the ItemsSource property.
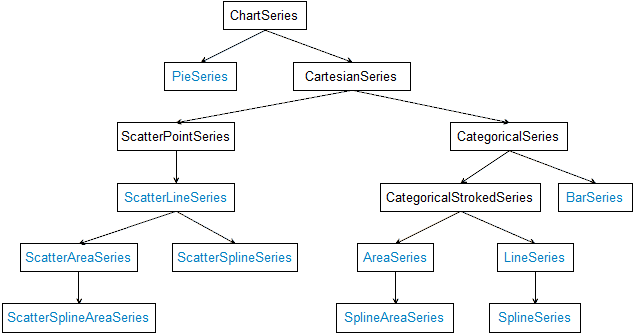
Series Class Hierarchy
Concrete series types are available for specific charts. For example, there is a set of CartesianSeries applicable in the context of a RadCartesianChart. Here is the hierarchy of all series:
Here are listed all supported series grouped by the chart types that can use them:
CartesianChart
-
CategoricalSeries
-
ScatterSeries