Area Series
Overview
RadCartesianChart visualizes AreaSeries as an area on the chart that is enclosed by the coordinate axes and straight line segments that connect the data points represented by these series. The AreaSeries extend CategoricalStrokedSeries, so they are also CategoricalSeries and require one CategoricalAxis and one NumricalAxis.
Features
- Fill : Defines the fill of the AreaSeries.
- Stroke : Changes the color used to draw lines.
- StrokeThickness : Changes the width of the lines.
Example
Here is an example how to create RadCartesianChart with Area Series:
First, create the needed business objects, for example:
public class CategoricalData
{
    public object Category { get; set; }

    public double Value { get; set; }
}
Then create a ViewModel:
public class CategoricalViewModel
{
    public ObservableCollection<CategoricalData> Data { get; set; }

    public CategoricalViewModel()
    {
        this.Data = GetCategoricalData();
    }

    private static ObservableCollection<CategoricalData> GetCategoricalData()
    {
        var data = new ObservableCollection<CategoricalData>
        {
            new CategoricalData { Category = "Greenings", Value = 52 },
            new CategoricalData { Category = "Perfecto", Value = 19 },
            new CategoricalData { Category = "NearBy", Value = 82 },
            new CategoricalData { Category = "Family", Value = 23 },
            new CategoricalData { Category = "Fresh", Value = 56 },
        };
        return data;
    }
}
Finally, use the following snippet to declare a RadCartesianChart with Area Series in XAML and in C#:
<telerikChart:RadCartesianChart>
    <telerikChart:RadCartesianChart.BindingContext>
        <local:CategoricalViewModel />
    </telerikChart:RadCartesianChart.BindingContext>
    <telerikChart:RadCartesianChart.HorizontalAxis>
        <telerikChart:CategoricalAxis LabelFitMode="MultiLine"
                                      PlotMode="OnTicks" />
    </telerikChart:RadCartesianChart.HorizontalAxis>
    <telerikChart:RadCartesianChart.VerticalAxis>
        <telerikChart:NumericalAxis />
    </telerikChart:RadCartesianChart.VerticalAxis>
    <telerikChart:RadCartesianChart.Series>
        <telerikChart:AreaSeries ValueBinding="Value"
                                 CategoryBinding="Category"
                                 ItemsSource="{Binding Data}" />
    </telerikChart:RadCartesianChart.Series>
</telerikChart:RadCartesianChart>
var chart = new RadCartesianChart
{
    BindingContext = new CategoricalViewModel(),
    HorizontalAxis = new CategoricalAxis()
    {
        LabelFitMode = AxisLabelFitMode.MultiLine,
        PlotMode = AxisPlotMode.OnTicks
    },
    VerticalAxis = new NumericalAxis(),
    Series =
    {
        new AreaSeries
        {
            ValueBinding = new PropertyNameDataPointBinding("Value"),
            CategoryBinding = new PropertyNameDataPointBinding("Category")
        }
    }
};

chart.Series[0].SetBinding(ChartSeries.ItemsSourceProperty, "Data");
Where the telerikChart namespace is the following:
xmlns:telerikChart="clr-namespace:Telerik.XamarinForms.Chart;assembly=Telerik.XamarinForms.Chart"
using Telerik.XamarinForms.Chart;
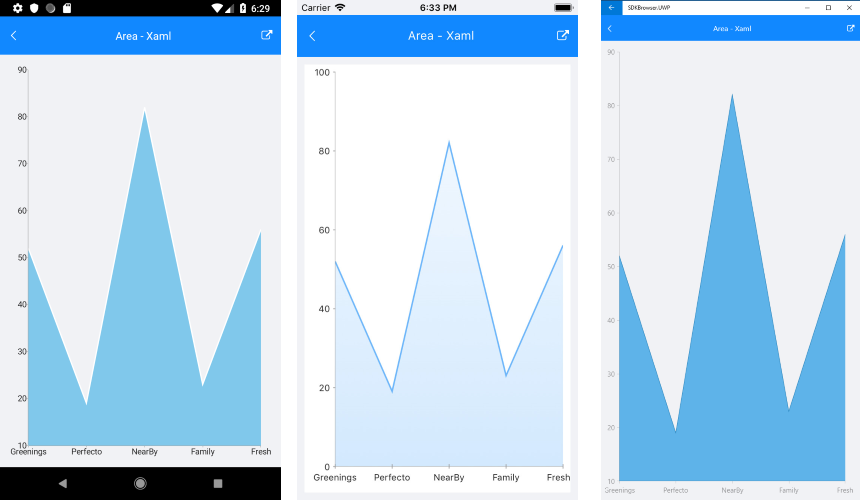
Here is the result:
Customization Example
Here we have some customizations:
    var series = new AreaSeries
    {
        Fill = new Color(0.8, 0.8, 1),
        Stroke = new Color(0.6, 0.6, 0.9),
        StrokeThickness = 5
    };
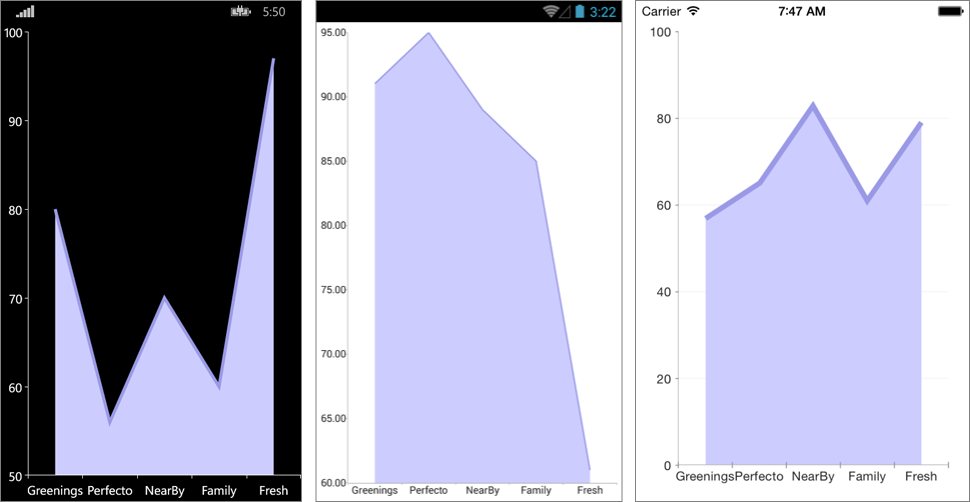
This is the final result:
A sample Ares Series example can be found in the Chart/Series folder of the SDK Samples Browser application.