Chart Legend
The Legend feature of the RadChart makes it easy for you to provide description regarding the series which are visualized within the control. In order to add the legend feature in your application, you need to initialize a new object of type RadLegend.
Chart Legend definition:
<telerikChart:RadPieChart x:Name="pieChart" HeightRequest="300">
    <telerikChart:RadCartesianChart.BindingContext>
        <local:ViewModel />
    </telerikChart:RadCartesianChart.BindingContext>
    <telerikChart:RadPieChart.Series>
        <telerikChart:PieSeries DisplayName="Value" LegendTitleBinding="Category" ItemsSource="{Binding Data1}" ValueBinding="Value"/>
    </telerikChart:RadPieChart.Series>
</telerikChart:RadPieChart>
<telerikChart:RadLegend HeightRequest="200"
                        LegendItemFontColor="DarkGreen"
                        LegendItemFontSize="20"
                        LegendProvider="{x:Reference Name=pieChart}"/>
var chart = new RadPieChart
{
    BindingContext = new ViewModel(),
    HeightRequest = 300
};
var series = new PieSeries
{
    ValueBinding = new PropertyNameDataPointBinding("Value"),
    DisplayName = "Value",
    LegendTitleBinding = new PropertyNameDataPointBinding("Category")
};
series.SetBinding(ChartSeries.ItemsSourceProperty, new Binding("Data1"));
chart.Series.Add(series);

var legend = new RadLegend
{
    LegendProvider = chart,
    HeightRequest = 200,
    LegendItemFontColor = Color.DarkGreen,
    LegendItemFontSize = 20
};
Figure 1: RadLegend in combination with PieChart
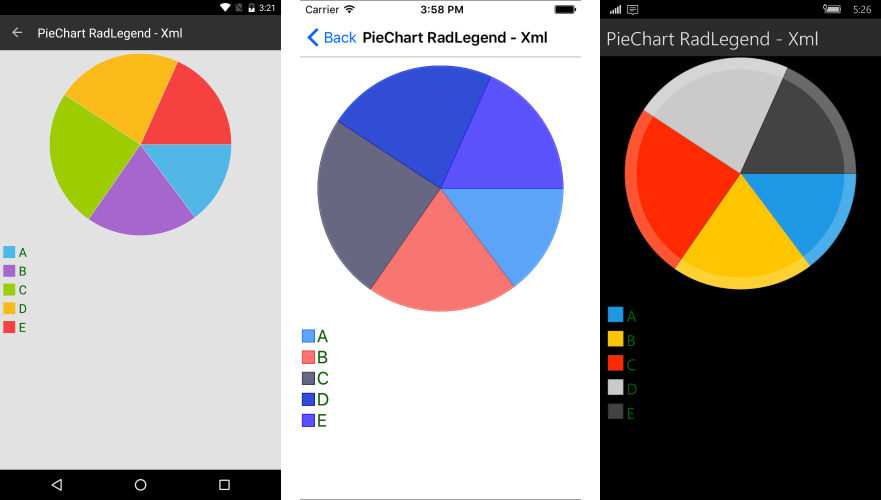
As shown in Figure 1, each item within the RadLegend represents particular series. The most important property which you need to set is the LegendProvider. It should point to the chart object whose series will be included in the legend.
Here are the most important properties of the RadLegend control. In brackets is commented the type of the property:
- LegendProvider(RadChartBase): The Chart control whose series will be described in the legend.
- LegendItemFontSize(double): The size of the item's title text.
- LegendItemFontColor(Color): The color of the item's title text.
- LegendItemIconSize(Size): The size of the title icons.
- Orientation(LegendOrientation): Sets the orientation of the legend. Can be Horizontal or Vertical.
The control can be used in combination with RadCartesianChart as well.
<telerikChart:RadCartesianChart x:Name="chart" HeightRequest="300">
  <telerikChart:RadCartesianChart.BindingContext>
    <local:ViewModel />
  </telerikChart:RadCartesianChart.BindingContext>
  <telerikChart:RadCartesianChart.HorizontalAxis>
    <telerikChart:CategoricalAxis />
  </telerikChart:RadCartesianChart.HorizontalAxis>
  <telerikChart:RadCartesianChart.VerticalAxis>
    <telerikChart:NumericalAxis />
  </telerikChart:RadCartesianChart.VerticalAxis>
  <telerikChart:RadCartesianChart.Series>
    <telerikChart:LineSeries CategoryBinding="Category"
                            ValueBinding="Value"
                            DisplayName=" Data1"
                            ItemsSource="{Binding Data1}" />
    <telerikChart:LineSeries CategoryBinding="Category"
                             ValueBinding="Value"
                             DisplayName=" Data2"
                             ItemsSource="{Binding Data2}" />
    <telerikChart:LineSeries CategoryBinding="Category"
                             ValueBinding="Value"
                             DisplayName=" Data3"
                             ItemsSource="{Binding Data3}" />
  </telerikChart:RadCartesianChart.Series>
</telerikChart:RadCartesianChart>
    <telerikChart:RadLegend LegendProvider="{x:Reference Name=chart}"
                            LegendItemFontColor="DarkGreen"
                            HeightRequest="200"/>
var chart = new RadCartesianChart
{
    HorizontalAxis = new CategoricalAxis(),
    VerticalAxis = new NumericalAxis(),
    BindingContext = new ViewModel(),
    HeightRequest = 300
};

var seriesData1 = new LineSeries
{
    CategoryBinding = new PropertyNameDataPointBinding("Category"),
    ValueBinding = new PropertyNameDataPointBinding("Value"),
    DisplayName = "Data1"
};

seriesData1.SetBinding(ChartSeries.ItemsSourceProperty, new Binding("Data1"));
chart.Series.Add(seriesData1);

var seriesData2 = new LineSeries
{
    CategoryBinding = new PropertyNameDataPointBinding("Category"),
    ValueBinding = new PropertyNameDataPointBinding("Value"),
    DisplayName = "Data2"
};

seriesData2.SetBinding(ChartSeries.ItemsSourceProperty, new Binding("Data2"));
chart.Series.Add(seriesData2);

var seriesData3 = new LineSeries
{
    CategoryBinding = new PropertyNameDataPointBinding("Category"),
    ValueBinding = new PropertyNameDataPointBinding("Value"),
    DisplayName = "Data3"
};

seriesData3.SetBinding(ChartSeries.ItemsSourceProperty, new Binding("Data3"));
chart.Series.Add(seriesData3);

var legend = new RadLegend
{
    LegendProvider = chart,
    HeightRequest = 200,
    LegendItemFontColor = Color.DarkGreen,
    Orientation = LegendOrientation.Vertical
};
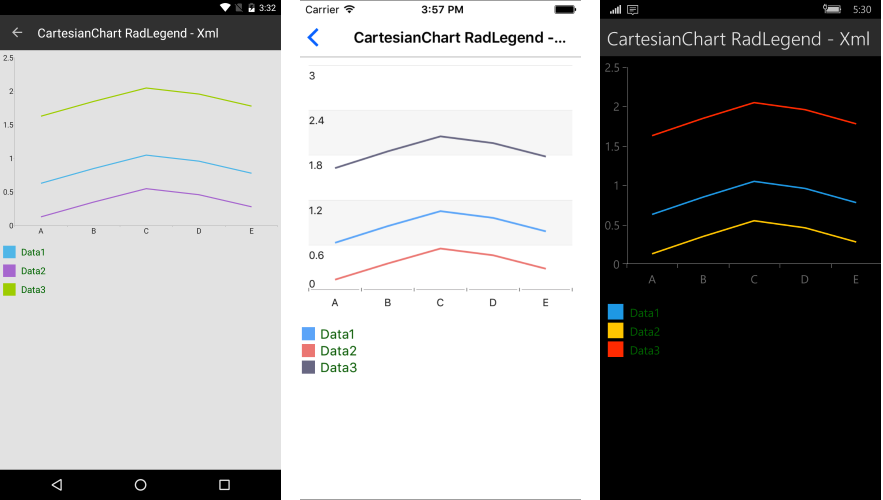
Figure 2: RadLegend in combination with CartesianChart
LegendTitleBinding
The LegendTitleBinding is a property which can be set specifically for the PieSeries. It points to the property of the data item which will be used as a title in the legend. For all other series, the DisplayName property will be used instead.
<telerikChart:RadPieChart.Series>
    <telerikChart:PieSeries DisplayName="Value" LegendTitleBinding="Category" ItemsSource="{Binding Data1}" ValueBinding="Value"/>
</telerikChart:RadPieChart.Series>
var series = new PieSeries
{
    ValueBinding = new PropertyNameDataPointBinding("Value"),
    DisplayName = "Value",
    LegendTitleBinding = new PropertyNameDataPointBinding("Category")
};