Financial Indicators
Overview
The financial, or also called stock indicators, are mainly used for keeping track of stock prices and patterns of price changes over time. You can find further information about what indicators are and what they are being used for by following this link: Short information about financial indicators.
In terms of using the indicators in the RadCartesianChart, you will need to add them as you would add any other Cartesian series. Every indicator has a related formula by which it calculates the expected result. All you need to do is provide the needed data.
There are two types of indicators in terms of setting their properties and getting them ready for displaying your stock data:
Indicators that have a category and a value(usually the close) bindings as well as one or more periods. Here are the available indicators:
- OscillatorIndicator
- RateOfChangeIndicator
- RelativeStrengthIndexIndicator
- TrixIndicator
- WeightedMovingAverageIndicator
- ExponentialMovingAverageIndicator
- AdaptiveMovingAverageKaufmanIndicator
- BollingerBandsIndicator
- RelativeMomentumIndexIndicator
- MacdIndicator
Indicators that have a category and high/low/close value bindings as well as none, one, or more periods:
- AverageTrueRangeIndicator
- CommodityChannelIndexIndicator
- StochasticFastIndicator
- StochasticSlowIndicator
- TrueRangeIndicator
- UltimateOscillatorIndicator
Example
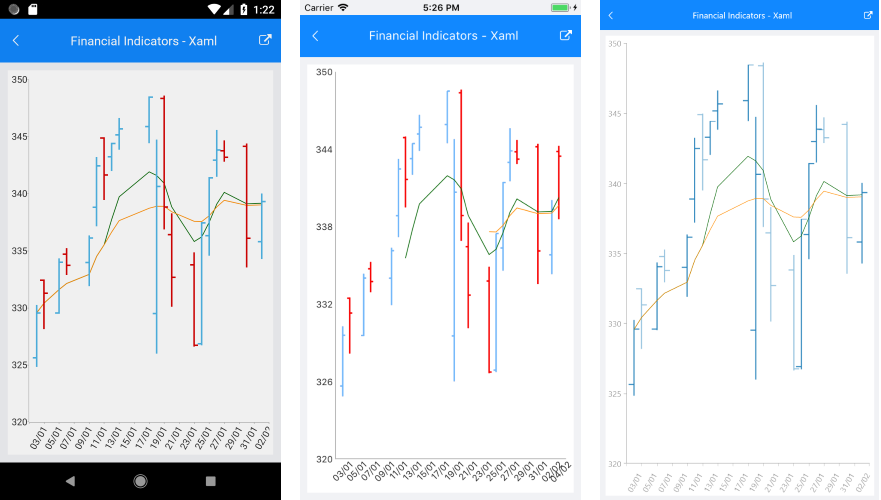
Here is an example of how to create a basic RadCartesianChart with OhlcSeries and a couple of ExponentialMovingAverageIndicator instances with different period set:
<telerikChart:RadCartesianChart PaletteName="Light"
                                SelectionPaletteName="LightSelected"
                                BackgroundColor="White" >
    <telerikChart:RadCartesianChart.BindingContext>
        <local:ViewModel />
    </telerikChart:RadCartesianChart.BindingContext>
    <telerikChart:RadCartesianChart.HorizontalAxis>
        <telerikChart:DateTimeContinuousAxis LineColor="#A9A9A9"
                                             LabelFitMode="Rotate"
                                             LabelFormat="dd/MM"
                                             PlotMode="BetweenTicks"
                                             MajorStep="2"
                                             MajorStepUnit="Day"/>
    </telerikChart:RadCartesianChart.HorizontalAxis>
    <telerikChart:RadCartesianChart.VerticalAxis>
        <telerikChart:NumericalAxis LineColor="#A9A9A9"
                                    Minimum="320"
                                    Maximum="350"
                                    MajorTickBackgroundColor="#A9A9A9" />
    </telerikChart:RadCartesianChart.VerticalAxis>
    <telerikChart:RadCartesianChart.Series>
        <telerikChart:OhlcSeries CategoryBinding="Category"
                                 DisplayName="AppleStocks-OHLC"
                                 OpenBinding="Open"
                                 HighBinding="High"
                                 LowBinding="Low"
                                 CloseBinding="Close"
                                 ItemsSource="{Binding SeriesData}"/>

        <telerikChart:ExponentialMovingAverageIndicator CategoryBinding="Category"
                                                        DisplayName="EMA 7days"
                                                        ValueBinding="Close"
                                                        Period="7"
                                                        StrokeThickness="1"
                                                        Stroke="DarkGreen"
                                                        ItemsSource="{Binding SeriesData}"/>

        <telerikChart:ExponentialMovingAverageIndicator CategoryBinding="Category"
                                                        DisplayName="EMA 14days"
                                                        ValueBinding="Close"
                                                        Period="14"
                                                        StrokeThickness="1"
                                                        Stroke="DarkOrange"
                                                        ItemsSource="{Binding SeriesData}"/>
    </telerikChart:RadCartesianChart.Series>
</telerikChart:RadCartesianChart>
var chart = new RadCartesianChart
{
    BackgroundColor = Color.White,
    BindingContext = new ViewModel(),
    HorizontalAxis = new DateTimeContinuousAxis()
    {
        LabelFitMode = AxisLabelFitMode.Rotate,
        PlotMode = AxisPlotMode.BetweenTicks,
        MajorStepUnit = TimeInterval.Day,
        MajorStep = 2,
        LabelFormat = "dd/MM",
        LineColor = Color.FromHex("#A9A9A9")
    },
    VerticalAxis = new NumericalAxis()
    {
        LineColor = Color.FromHex("#A9A9A9"),
        Maximum = 350,
        Minimum = 320,
        MajorTickBackgroundColor = Color.FromHex("#A9A9A9")
    },
    Series =
    {
        new OhlcSeries
        {
           CategoryBinding = new PropertyNameDataPointBinding("Category"),
           OpenBinding = new PropertyNameDataPointBinding("Open"),
           HighBinding = new PropertyNameDataPointBinding("High"),
           LowBinding = new PropertyNameDataPointBinding("Low"),
           CloseBinding = new PropertyNameDataPointBinding("Close")
        },
        new ExponentialMovingAverageIndicator
        {
            CategoryBinding = new PropertyNameDataPointBinding("Category"),
            ValueBinding = new PropertyNameDataPointBinding("Close"),
            Period = 7,
            Stroke = Color.DarkGreen,
            StrokeThickness = 1,
            DisplayName = "EMA 7days"
        },
        new ExponentialMovingAverageIndicator
        {
            CategoryBinding = new PropertyNameDataPointBinding("Category"),
            ValueBinding = new PropertyNameDataPointBinding("Close"),
            Period = 14,
            Stroke = Color.DarkOrange,
            StrokeThickness = 1,
            DisplayName = "EMA 14days"
        }
    }
};

chart.Series[0].SetBinding(ChartSeries.ItemsSourceProperty, "SeriesData");
chart.Series[1].SetBinding(ChartSeries.ItemsSourceProperty, "SeriesData");
chart.Series[2].SetBinding(ChartSeries.ItemsSourceProperty, "SeriesData");
Add the following namespace:
xmlns:telerikChart="clr-namespace:Telerik.XamarinForms.Chart;assembly=Telerik.XamarinForms.Chart"
Here is how the business model is defined:
public class OhlcDataPoint : NotifyPropertyChangedBase
{
    private DateTime category;
    private double open;
    private double high;
    private double low;
    private double close;

    public DateTime Category
    {
        get { return this.category; }
        set
        {
            if (value != this.category)
            {
                this.category = value;
                this.OnPropertyChanged();
            }
        }
    }

    public double Open
    {
        get { return this.open; }
        set
        {
            if (value != this.open)
            {
                this.open = value;
                this.OnPropertyChanged();
            }
        }
    }

    public double High
    {
        get { return this.high; }
        set
        {
            if (value != this.high)
            {
                this.high = value;
                this.OnPropertyChanged();
            }
        }
    }

    public double Low
    {
        get { return this.low; }
        set
        {
            if (value != this.low)
            {
                this.low = value;
                this.OnPropertyChanged();
            }
        }
    }

    public double Close
    {
        get { return this.close; }
        set
        {
            if (value != this.close)
            {
                this.close = value;
                this.OnPropertyChanged();
            }
        }
    }
}
And here is the result:
SDK Browser application contains an example that shows how to use the Financial Indicators. You can find the application in the Examples folder of your local Telerik UI for Xamarin installation.