Null Values
There are many scenarios, in which some of the data points visualized in RadChart contain empty/null values. These are the cases when data is not available for some records from the used dataset. In cases of CartesianSeries that require X and Y axes (line, area, bar, etc), RadChart represents null data points with an empty space or gap. In case of other chart types (pie, donut) these data points are not visualized.
The following example demonstrates a databound scenario where nullable double type is used.
First, create a ViewModel with a collection of CategoryItems objects, where a few of the items have null values:
public class ViewModel
{
    public ViewModel()
    {
        this.Data = new ObservableCollection<CategoryItem>()
        {
            new CategoryItem { Category = "A" },
            new CategoryItem { Category = "B", Value = 70 },
            new CategoryItem { Category = "C", Value = 80 },
            new CategoryItem { Category = "D", Value = 50 },
            new CategoryItem { Category = "E", Value = 40 },
            new CategoryItem { Category = "F" },
            new CategoryItem { Category = "G" },
            new CategoryItem { Category = "H", Value = 30 },
            new CategoryItem { Category = "I", Value = 60 },
            new CategoryItem { Category = "J", Value = 80 },
            new CategoryItem { Category = "K", Value = 85 },
            new CategoryItem { Category = "L", Value = 90 }
        };
    }

    public ObservableCollection<CategoryItem> Data { get; private set; }
}

public class CategoryItem
{
    public string Category { get; set; }
    public double? Value { get; set; }
}
Then, add RadCartesianChart with SplineAreaSeries, for example:
<telerikChart:RadCartesianChart>
    <telerikChart:RadCartesianChart.BindingContext>
        <local:ViewModel />
    </telerikChart:RadCartesianChart.BindingContext>
    <telerikChart:RadCartesianChart.HorizontalAxis>
        <telerikChart:CategoricalAxis />
    </telerikChart:RadCartesianChart.HorizontalAxis>
    <telerikChart:RadCartesianChart.VerticalAxis>
        <telerikChart:NumericalAxis Minimum="0" Maximum="100" />
    </telerikChart:RadCartesianChart.VerticalAxis>
    <telerikChart:RadCartesianChart.Series>
        <telerikChart:SplineAreaSeries ValueBinding="Value"
                                       CategoryBinding="Category"
                                       ItemsSource="{Binding Data}" />
    </telerikChart:RadCartesianChart.Series>
</telerikChart:RadCartesianChart>
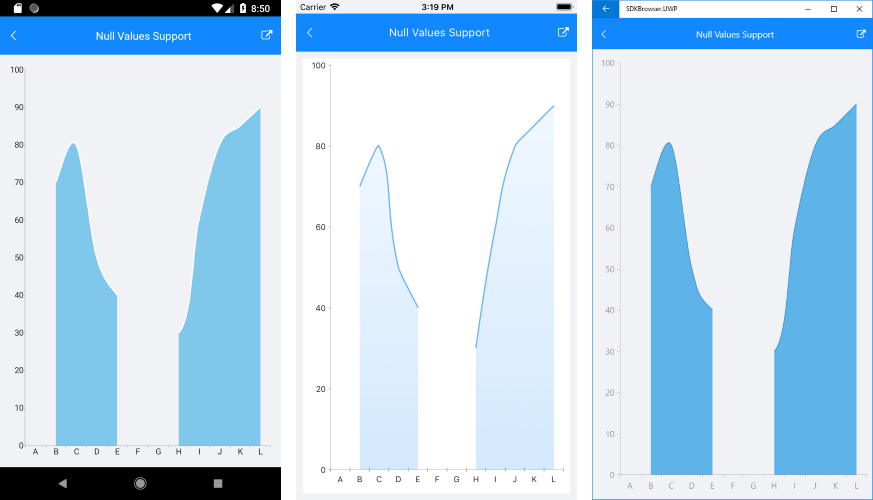
The image below shows how the null data points are visualized as gaps.