ScatterLine Series
Overview
The ScatterLineSeries are represented on the chart as data points connected with straight line segments. The ScatterLineSeries inherit from the ScatterPointSeries class and also require both axes of the chart to be of type NumericalAxis.
Features
ScatterLineSeries provide the following properties to change their style:
- Stroke (Color): changes the color used to draw lines.
- StrokeThickness (double): changes the width of the lines.
If you want to style the series, on iOS both
StrokeandStrokeThicknessmust be set
Example
Here is an example how to create RadCartesianChart with ScatterLine Series:
First, create the needed business objects, for example:
public class NumericalData
{
    public double XData { get; set; }
    public double YData { get; set; }
}
Then create a ViewModel:
public class SeriesNumericalViewModel
{
    public ObservableCollection<NumericalData> Data1 { get; set; }
    public ObservableCollection<NumericalData> Data2 { get; set; }

    public SeriesNumericalViewModel()
    {
        this.Data1 = GetNumericData1();
        this.Data2 = GetNumericData2();
    }

    public static ObservableCollection<NumericalData> GetNumericData1()
    {
        var data = new ObservableCollection<NumericalData>
        {
            new NumericalData { XData = 2, YData = 13 },
            new NumericalData { XData = 19, YData = 31 },
            new NumericalData { XData = 22, YData = 33 },
            new NumericalData { XData = 28, YData = 35 },
            new NumericalData { XData = 33, YData = 46 },
            new NumericalData { XData = 38, YData = 34 },
            new NumericalData { XData = 49, YData = 66 },
            new NumericalData { XData = 55, YData = 24 },
            new NumericalData { XData = 62, YData = 41 },
        };
        return data;
    }
    public static ObservableCollection<NumericalData> GetNumericData2()
    {
        var data = new ObservableCollection<NumericalData>
        {
            new NumericalData { XData = 7, YData = 13 },
            new NumericalData { XData = 19, YData = 17 },
            new NumericalData { XData = 22, YData = 19 },
            new NumericalData { XData = 28, YData = 21 },
            new NumericalData { XData = 33, YData = 35 },
            new NumericalData { XData = 38, YData = 43 },
            new NumericalData { XData = 49, YData = 15 },
            new NumericalData { XData = 55, YData = 21 },
            new NumericalData { XData = 62, YData = 47 },
        };
        return data;
    }
}
Finally, use the following snippet to declare a RadCartesianChart with ScatterLine Series in XAML and in C#:
<telerikChart:RadCartesianChart>
    <telerikChart:RadCartesianChart.BindingContext>
        <local:SeriesNumericalViewModel />
    </telerikChart:RadCartesianChart.BindingContext>
    <telerikChart:RadCartesianChart.HorizontalAxis>
        <telerikChart:NumericalAxis LabelFitMode="MultiLine" />
    </telerikChart:RadCartesianChart.HorizontalAxis>
    <telerikChart:RadCartesianChart.VerticalAxis>
        <telerikChart:NumericalAxis />
    </telerikChart:RadCartesianChart.VerticalAxis>
    <telerikChart:RadCartesianChart.Series>
        <telerikChart:ScatterLineSeries XValueBinding="XData"
                                        YValueBinding="YData"
                                        ItemsSource="{Binding Data1}" />
        <telerikChart:ScatterLineSeries XValueBinding="XData"
                                        YValueBinding="YData"
                                        ItemsSource="{Binding Data2}" />
    </telerikChart:RadCartesianChart.Series>
</telerikChart:RadCartesianChart>
var chart = new RadCartesianChart
{
    BindingContext = new SeriesNumericalViewModel(),
    HorizontalAxis = new NumericalAxis()
    {
        LabelFitMode = AxisLabelFitMode.MultiLine
    },
    VerticalAxis = new NumericalAxis(),
    Series =
    {
        new ScatterLineSeries
        {
            XValueBinding = new PropertyNameDataPointBinding("XData"),
            YValueBinding = new PropertyNameDataPointBinding("YData")
        },
        new ScatterLineSeries
        {
            XValueBinding = new PropertyNameDataPointBinding("XData"),
            YValueBinding = new PropertyNameDataPointBinding("YData")
        }
    }
};

chart.Series[0].SetBinding(ChartSeries.ItemsSourceProperty, "Data1");
chart.Series[1].SetBinding(ChartSeries.ItemsSourceProperty, "Data2");
Where the telerikChart namespace is the following:
xmlns:telerikChart="clr-namespace:Telerik.XamarinForms.Chart;assembly=Telerik.XamarinForms.Chart"
using Telerik.XamarinForms.Chart;
And here is the result:
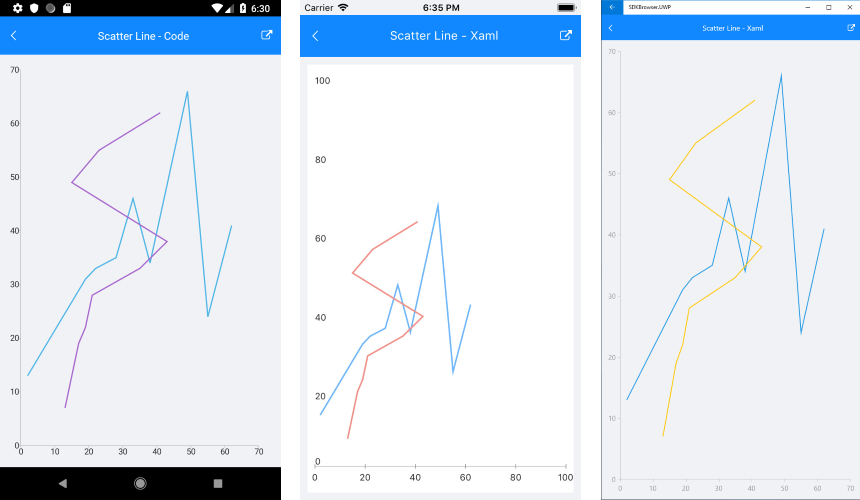
A sample ScatterLine Series example can be found in the Chart/Series folder of the SDK Samples Browser application.
Customization Example
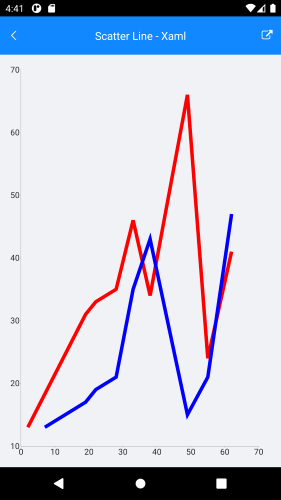
Here we make some customizations on the ScatterLine Series applying Stroke and StrokeThickness to the series. We extended the example above:
<telerikChart:RadCartesianChart>
    <telerikChart:RadCartesianChart.BindingContext>
        <local:SeriesNumericalViewModel />
    </telerikChart:RadCartesianChart.BindingContext>
    <telerikChart:RadCartesianChart.HorizontalAxis>
        <telerikChart:NumericalAxis LabelFitMode="MultiLine" />
    </telerikChart:RadCartesianChart.HorizontalAxis>
    <telerikChart:RadCartesianChart.VerticalAxis>
        <telerikChart:NumericalAxis />
    </telerikChart:RadCartesianChart.VerticalAxis>
    <telerikChart:RadCartesianChart.Series>
        <telerikChart:ScatterLineSeries XValueBinding="XData"
                                        YValueBinding="YData"
                                        Stroke="Red"
                                        StrokeThickness="5"
                                        ItemsSource="{Binding Data1}" />
        <telerikChart:ScatterLineSeries XValueBinding="XData"
                                        YValueBinding="YData"
                                        Stroke="Blue"
                                        StrokeThickness="5"
                                        ItemsSource="{Binding Data2}" />
    </telerikChart:RadCartesianChart.Series>
</telerikChart:RadCartesianChart>
Here is the result: