Common Features
- ItemsSource(IList): Defines the data set that will fill the series data points.
- DisplayName(string): The display name of the series.
Selection
-
AllowSelect(bool): Specifies whether the series is selectable. If the property value is
true, the selection is handled by the chart selection behavior.
- IsSelected(bool): Specifies whether the series is selected.
Labels customization
RadChart provides the option to display data point labels in the plot area through the ShowLabels property of the ChartSeries.
You could customize the series labels text using the properties below:
- ShowLabels(bool): Defines whether the series will display labels for each plotted data point.
- LabelBinding(PropertyNameDataPointBinding): Allows the user to bind the series labels to a property of the data point item.
-
LabelFormat(string): Sets label format string such as
"N","P2". - LabelFormatter(ILabelFormatter): Allows custom series label formatting.
Example
Here is a quick example how you could apply LabelFormat to a LineSeries:
First, create the needed business objects, for example:
public class TemporalData
{
    public DateTime Date { get; set; }

    public double Value { get; set; }
}
Then create a ViewModel:
public class ViewModel
{
    public ObservableCollection<TemporalData> Data { get; set; }

    public ViewModel()
    {
        this.Data = GetDateTimeData(6);
    }

    private static ObservableCollection<TemporalData> GetDateTimeData(int itemsCount)
    {
        var startDate = new DateTime(2018, 03, 01);

        ObservableCollection<TemporalData> items = new ObservableCollection<TemporalData>();
        for (int i = 0; i < itemsCount; i++)
        {
            TemporalData data = new TemporalData();
            data.Date = startDate.AddDays(i);
            data.Value = Math.Sin(i);

            items.Add(data);
        }

        return items;
    }
}
Finally, use the following snippet to declare a RadCartesianChart with Line Series in XAML and in C#:
<telerikChart:RadCartesianChart x:Name="chart">
    <telerikChart:RadCartesianChart.BindingContext>
        <local:ViewModel />
    </telerikChart:RadCartesianChart.BindingContext>
    <telerikChart:RadCartesianChart.HorizontalAxis>
        <telerikChart:DateTimeContinuousAxis LabelFitMode="Rotate"
                                             MajorStepUnit="Day" />
    </telerikChart:RadCartesianChart.HorizontalAxis>
    <telerikChart:RadCartesianChart.VerticalAxis>
        <telerikChart:NumericalAxis Minimum="-1.5"
                                    Maximum="1.5" />
    </telerikChart:RadCartesianChart.VerticalAxis>
    <telerikChart:RadCartesianChart.Series>
        <telerikChart:LineSeries ValueBinding="Value"
                                 CategoryBinding="Date"
                                 ItemsSource="{Binding Data}"
                                 ShowLabels="True"
                                 LabelFormat="{}{0:N2}"
                                 />
    </telerikChart:RadCartesianChart.Series>
var chart = new RadCartesianChart
{
    BindingContext = new ViewModel(),
    VerticalAxis = new NumericalAxis
    {
        Minimum = -1.5,
        Maximum = 1.5
    },
    HorizontalAxis = new DateTimeContinuousAxis
    {
        LabelFitMode = AxisLabelFitMode.Rotate,
        MajorStepUnit = TimeInterval.Day,
    },
    Series =
    {
        new LineSeries
        {
            ValueBinding = new PropertyNameDataPointBinding("Value"),
            CategoryBinding = new PropertyNameDataPointBinding("Date"),
            ShowLabels = true,
            LabelFormat = "{0:N2}"
        }
    }
};

chart.Series[0].SetBinding(ChartSeries.ItemsSourceProperty, "Data");
And the result is:
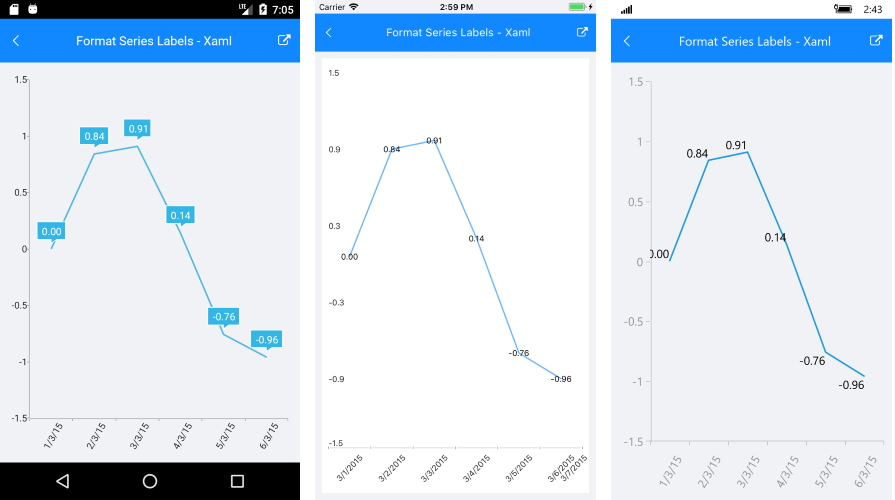
You can find detailed information about the supported numeric formats here: Standard Numeric Format Strings.
Categorical Series Features
Data Binding
All categorical series have CategoryBinding and ValueBinding properties. These properties are of PropertyNameDataPointBinding and specify the name of the property from the data model used by the chart to plot the corresponding visual points.
Combining
The categorical series could be combined. Several combining strategies are supported. You can take a look at the Grouping example.
Scatter Series Common Features
Data Binding
Scatter series provide XValueBinding and YValueBinding properties for data binding to a view model. These properties are of PropertyNameDataPointBinding and specify the name of the property from the data model used by the chart to plot the corresponding visual points.