New to Telerik UI for .NET MAUI? Start a free 30-day trial

.NET MAUI Chart Categorical Series Orientation

The orientation of the series depends on which chart axis is horizontal and which one is vertical.

The Orientation property can be applied only to Categorical Series, such as Bar, Line, and Area.

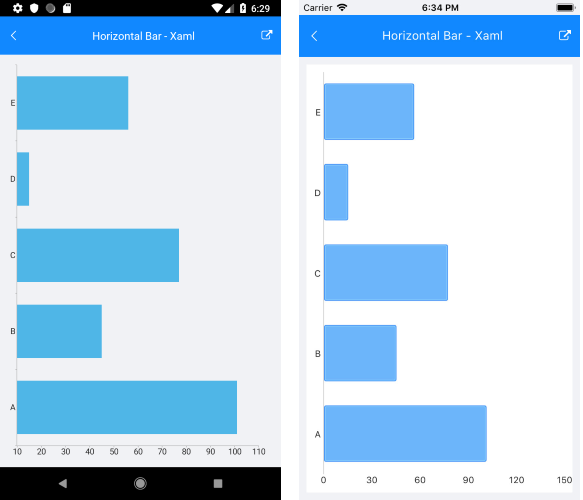
Horizontal Bar Series Example

The following example shows how to create a Cartesian Chart with a vertical CategoricalAxis and a Horizontal Bar Series:

1. Create the needed business objects, for example:

public class CategoricalData
{
    public object Category { get; set; }
    public double Value { get; set; }
}

2. Create a ViewModel:

public class CategoricalDataViewModel
{
    public ObservableCollection<CategoricalData> Data { get; set; }

    public CategoricalDataViewModel()
    {
        this.Data = GetCategoricalData();
    }

    private static ObservableCollection<CategoricalData> GetCategoricalData()
    {
        var data = new ObservableCollection<CategoricalData>
        {
            new CategoricalData { Category = "A", Value = 101 },
            new CategoricalData { Category = "B", Value = 45 },
            new CategoricalData { Category = "C", Value = 77 },
            new CategoricalData { Category = "D", Value = 15 },
            new CategoricalData { Category = "E", Value = 56 },
        };
        return data;
    }
}

3. Use the following snippet to declare a RadCartesianChart with a Bar Series in XAML:

<telerik:RadCartesianChart>
    <telerik:RadCartesianChart.BindingContext>
        <local:CategoricalDataViewModel />
    </telerik:RadCartesianChart.BindingContext>
    <telerik:RadCartesianChart.VerticalAxis>
        <telerik:CategoricalAxis />
    </telerik:RadCartesianChart.VerticalAxis>
    <telerik:RadCartesianChart.HorizontalAxis>
        <telerik:NumericalAxis />
    </telerik:RadCartesianChart.HorizontalAxis>
    <telerik:RadCartesianChart.Series>
        <telerik:BarSeries ValueBinding="Value"
                                CategoryBinding="Category"
                                ItemsSource="{Binding Data}" />
    </telerik:RadCartesianChart.Series>
</telerik:RadCartesianChart>

The following image shows the end result.

Horizontal BarSeries

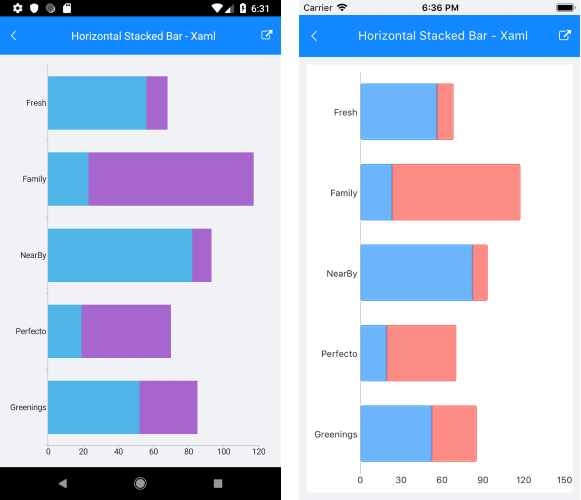
Horizontal Stack Bar Series Example

The following example shows how to create a Cartesian Chart with a vertical CategoricalAxis and a Stack Horizontal Bar Series:

1. Create the needed business objects, for example:

public class CategoricalData
{
    public object Category { get; set; }
    public double Value { get; set; }
}

2. Create a ViewModel:

public class SeriesCategoricalViewModel
{
    public ObservableCollection<CategoricalData> Data1 { get; set; }
    public ObservableCollection<CategoricalData> Data2 { get; set; }

    public SeriesCategoricalViewModel()
    {
        this.Data1 = GetCategoricalData1();
        this.Data2 = GetCategoricalData2();
    }

    private static ObservableCollection<CategoricalData> GetCategoricalData1()
    {
        var data = new ObservableCollection<CategoricalData>
        {
            new CategoricalData { Category = "Greenings", Value = 52 },
            new CategoricalData { Category = "Perfecto", Value = 19 },
            new CategoricalData { Category = "NearBy", Value = 82 },
            new CategoricalData { Category = "Family", Value = 23 },
            new CategoricalData { Category = "Fresh", Value = 56 },
        };
        return data;
    }

    private static ObservableCollection<CategoricalData> GetCategoricalData2()
    {
        var data = new ObservableCollection<CategoricalData>
        {
            new CategoricalData { Category = "Greenings", Value = 33 },
            new CategoricalData { Category = "Perfecto", Value = 51 },
            new CategoricalData { Category = "NearBy", Value = 11 },
            new CategoricalData { Category = "Family", Value = 94 },
            new CategoricalData { Category = "Fresh", Value = 12 },
        };
        return data;
    }
}

3. Use the following snippet to declare a Cartesian Chart with a Bar Series in XAML:

<telerik:RadCartesianChart>
    <telerik:RadCartesianChart.BindingContext>
        <local:SeriesCategoricalViewModel />
    </telerik:RadCartesianChart.BindingContext>
    <telerik:RadCartesianChart.VerticalAxis>
        <telerik:CategoricalAxis />
    </telerik:RadCartesianChart.VerticalAxis>
    <telerik:RadCartesianChart.HorizontalAxis>
        <telerik:NumericalAxis />
    </telerik:RadCartesianChart.HorizontalAxis>
    <telerik:RadCartesianChart.Series>
        <telerik:BarSeries ValueBinding="Value"
                        CategoryBinding="Category"
                        CombineMode="Stack"
                        ItemsSource="{Binding Data1}" />
        <telerik:BarSeries ValueBinding="Value"
                        CategoryBinding="Category"
                        CombineMode="Stack"
                        ItemsSource="{Binding Data2}" />
    </telerik:RadCartesianChart.Series>
</telerik:RadCartesianChart>

The following image shows the end result:

Horizontal BarSeries

See Also

In this article