.NET MAUI Chart SplineArea Series
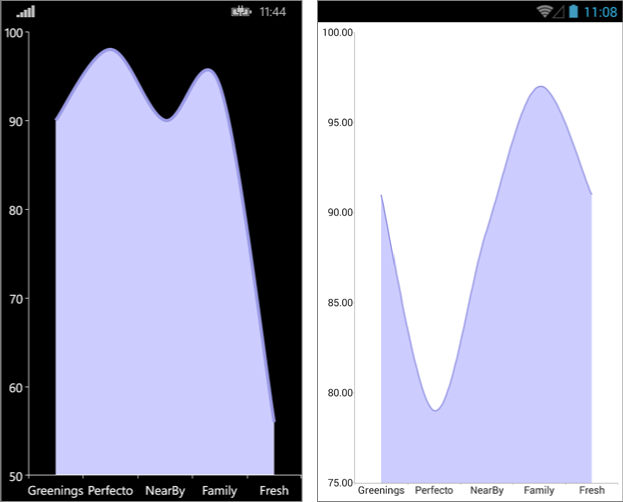
The Cartesian Chart visualizes the SplineArea Series as an area on the chart that is enclosed by the coordinate axes and straight line segments, which connect the data points represented by these series. The SplineArea Series extend the Categorical Stroked Series, so they are also Categorical Series and require one Categorical Axis and one Numerical Axis.
Features
The SplineArea Series provides the following properties:
-
Stroke(Color)—Changes the color for drawing lines. -
StrokeThickness(double)—Changes the width of the lines. -
Fill(Color)—Changes the color for filling the area shapes.
SplineArea Series Example
The following example shows how to create a RadCartesianChart with a SplineArea Series:
1. Create the needed business objects, for example:
2. reate a ViewModel:
3. Use the following snippet to declare a RadCartesianChart with a SplineArea Series in XAML and in C#:
The following image shows the end result:

Customization Example
You can further customize the SplineArea Series: