.NET MAUI Cartesian Chart Grid
The Cartesian Chart Grid represents a decoration over the plot area of RadCartesianChart. It adds major lines connected to each Major tick of each axis. You can set a new grid through the RadCartesianChart.Grid property.
Features
The Cartesian Chart Grid provides the following features:
-
MajorLinesVisibility—Gets or sets the visibility of major grid lines; in other words, a line that extends the major ticks throughout the plot area. -
MajorLineThickness—Gets or sets the thickness of the major grid lines. -
MajorLineColor—Gets or sets the color the of major grid lines. -
MajorXLineDashArray—Gets or sets a collection of double values that indicates the pattern of dashes and gaps that is used to outline the X major grid line. -
MajorYLineDashArray—Gets or sets a collection of double values that indicates the pattern of dashes and gaps that is used to outline Y major grid line. -
StripeLinesVisibility—Gets or sets the visibility of the grid stripes; in other words, the area between two grid lines. -
YStripeColor—Gets or sets the color of the area between two major ticks of the Vertical Axis. This color alternates with theYStripeAlternativeColorstarting from the first area. -
YStripeAlternativeColor—Gets or sets the color of the area between two major ticks of the Vertical Axis. This color alternates with theYStripeColorstarting from the second area. -
XStripeColor—Gets or sets the color of the area between two major ticks of the Horizontal Axis. This color alternates with theXStripeAlternativeColorstarting from the first area. -
XStripeAlternativeColor—Gets or sets the color of the area between two major ticks of the Horizontal Axis. This color alternates with theXStripeAlternativeColorstarting from the second area.
Example
The following example shows how the Cartesian Chart Grid works:
1. Create the needed business objects:
public class CategoricalData
{
    public object Category { get; set; }
    public double Value { get; set; }
}
2. Create a ViewModel:
public class ViewModel
{
    public ObservableCollection<CategoricalData> Data { get; set; }

    public ViewModel()
    {
        this.Data = GetCategoricalData();
    }

    private static ObservableCollection<CategoricalData> GetCategoricalData()
    {
        var data = new ObservableCollection<CategoricalData>
        {
            new CategoricalData { Category = "Greenings", Value = 21 },
            new CategoricalData { Category = "Perfecto", Value = 44 },
            new CategoricalData { Category = "NearBy", Value = 39 },
            new CategoricalData { Category = "Family", Value = 11 },
            new CategoricalData { Category = "Fresh", Value = 83 },
        };
        return data;
    }
}
3. Declare the RadChart in XAML:
<telerik:RadCartesianChart>
    <telerik:RadCartesianChart.BindingContext>
        <local:ViewModel />
    </telerik:RadCartesianChart.BindingContext>
    <telerik:RadCartesianChart.VerticalAxis>
        <telerik:NumericalAxis />
    </telerik:RadCartesianChart.VerticalAxis>
    <telerik:RadCartesianChart.HorizontalAxis>
        <telerik:CategoricalAxis LabelFitMode="MultiLine" />
    </telerik:RadCartesianChart.HorizontalAxis>
    <telerik:RadCartesianChart.Series>
        <telerik:BarSeries ValueBinding="Value"
                                CategoryBinding="Category"
                                ItemsSource="{Binding Data}" />
    </telerik:RadCartesianChart.Series>
    <telerik:RadCartesianChart.Grid>
        <telerik:CartesianChartGrid StripLinesVisibility="Y"
                                         MajorLinesVisibility="XY"
                                         MajorLineColor="LightGreen"
                                         MajorLineThickness="3" />
    </telerik:RadCartesianChart.Grid>
</telerik:RadCartesianChart>
4. Add the following namespace:
xmlns:telerik="http://schemas.telerik.com/2022/xaml/maui"
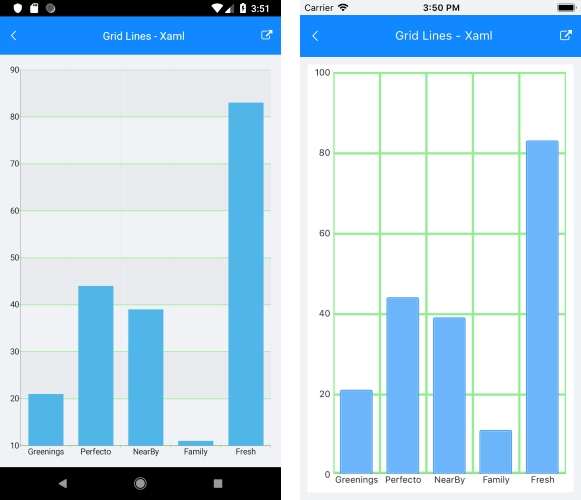
The following image shows how the CartesianGridLineAnnotation looks: