New to Telerik UI for .NET MAUI? Start a free 30-day trial

.NET MAUI Chart ScatterArea Series

The Cartesian Chart visualizes the ScatterArea Series as the area enclosed by the coordinate axes and straight line segments that connect the series data points. The ScatterArea Series inherit from the [ScatterPointSeries]() class and also require both Chart axes to be Numerical Axes.

Features

The ScatterArea Series provides the following properties to change its style:

  • Stroke (Color)—Changes the color for drawing lines.
  • StrokeThickness (double)—Changes the width of the lines.
  • Fill (Color)—Changes the color of the chart area.

ScatterArea Series Example

The following example shows how to create a RadCartesianChart with a ScatterArea Series:

1. Create the needed business objects, for example:

public class NumericalData
{
    public double XData { get; set; }
    public double YData { get; set; }
}

2. Create a ViewModel:

public class NumericalViewModel
{
    public ObservableCollection<NumericalData> Data { get; set; }

    public NumericalViewModel()
    {
        this.Data = GetNumericData();
    }

    public static ObservableCollection<NumericalData> GetNumericData()
    {
        var data = new ObservableCollection<NumericalData>
        {
            new NumericalData { XData = 4, YData = 9 },
            new NumericalData { XData = 8, YData = 10 },
            new NumericalData { XData = 9, YData = 13 },
            new NumericalData { XData = 12, YData = 24 },
            new NumericalData { XData = 17, YData = 24 },
            new NumericalData { XData = 21, YData = 4 },
            new NumericalData { XData = 26, YData = 13 },
            new NumericalData { XData = 29, YData = 3 },
            new NumericalData { XData = 30, YData = 16 },
        };
        return data;
    }
}

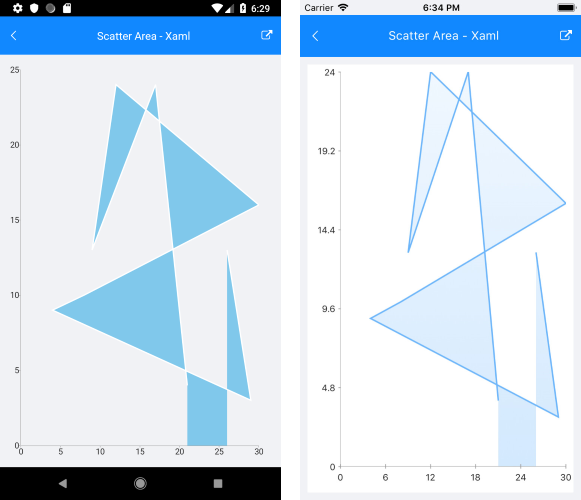
3. Use the following snippet to declare a Cartesian Chart with a ScatterArea Series in XAML:

<telerik:RadCartesianChart>
    <telerik:RadCartesianChart.BindingContext>
        <local:NumericalViewModel />
    </telerik:RadCartesianChart.BindingContext>
    <telerik:RadCartesianChart.HorizontalAxis>
        <telerik:NumericalAxis LabelFitMode="MultiLine" />
    </telerik:RadCartesianChart.HorizontalAxis>
    <telerik:RadCartesianChart.VerticalAxis>
        <telerik:NumericalAxis />
    </telerik:RadCartesianChart.VerticalAxis>
    <telerik:RadCartesianChart.Series>
        <telerik:ScatterAreaSeries XValueBinding="XData"
                                YValueBinding="YData"
                                ItemsSource="{Binding Data}" />
    </telerik:RadCartesianChart.Series>
</telerik:RadCartesianChart>

The following image shows the end result:

Basic ScatterAreaSeries

Customization Example

You can further customize the ScatterArea Series:

var series = new ScatterAreaSeries
{
    Stroke = new Color(0.6, 0.6, 0.9),
    StrokeThickness = 5,
    Fill = new Color(0.8, 0.8, 1)
};

See Also

In this article