Extending a Band Report in Few Easy Steps
This topic will extend the example Creating a Simple Report to show several unique Telerik Reporting features including:
- In Place Editing.
- Copying and pasting styles.
- Conditional formatting.
- Navigating and sizing report items.
- Resizing report sections.
- Adding Text, Shape and PictureBox report items to the report designer.
- Using the Data Explorer.
- Using the Report Explorer.
Use the report design created in Creating a Simple Report as a starting point.
-
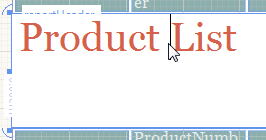
Double click the "ProductList" TextBox report item in the report header. This will activate the "in place" editor, allowing you to enter text right in the designer without having to find the appropriate property in the Property Window. Add a space so the TextBox reads "Product List".
-
Zoom to 150% from the Zoom Combo Box in the lower left corner of the design surface.
-
For Visual Studio Report Designer: From the ToolBox window drag a TextBox item to the report header just to the right of the "Quantity" column. While dragging the TextBox, the Snap Lines will aid you in positioning it so it aligns nicely with its neighbors.
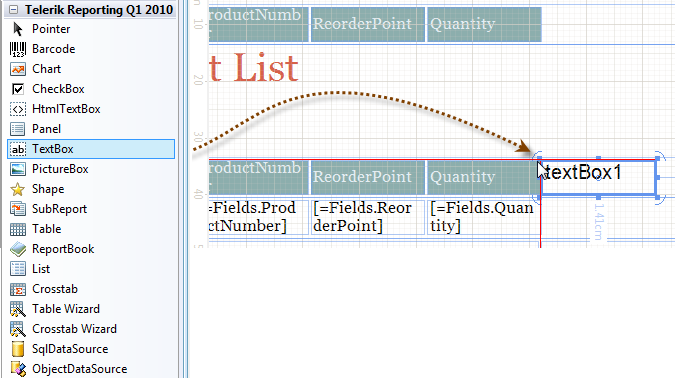
For Standalone Report Designer: Select the target report section and from the Insert tab click on the TextBox item. The TextBox item is added to the selected report section and with dragging you can position the TextBox in the correct location. Double-click the TextBox and enter "Reorder".
-
Select the "Quantity" TextBox and copy the style rule applied in the StyleName property. Select the "Reorder" field and paste the style rule in its StyleName property.
-
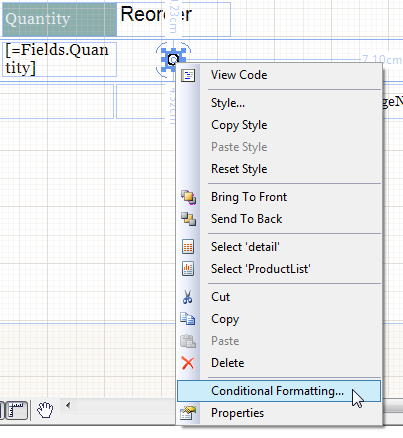
In these next steps you define a circle Shape item that reacts to changes in the data so that when inventory falls below 50% of the "reorder point" quantity the circle will be filled in red. Add a new Shape item to the detail section just below the "Reorder" column. In the Properties window set the Size.Width property to "0.1in" and the Size.Height property to "0.1in". Right click the Shape item and select Conditional Formatting from the context menu.
-
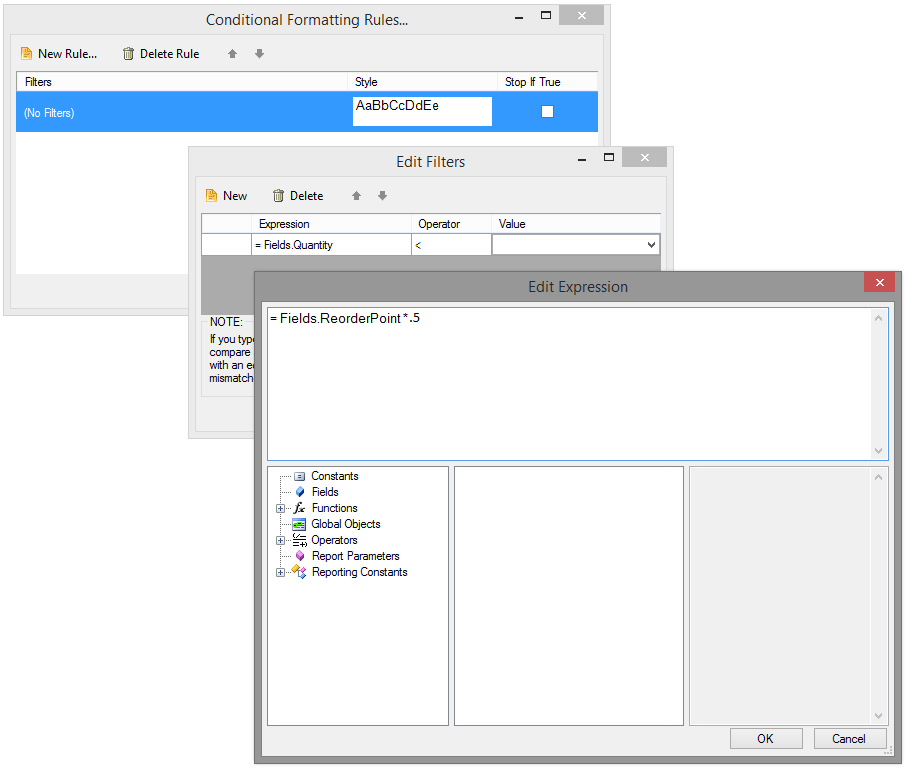
The Conditional Formatting Rules dialog will display.
- Click the New Rule button and a new row will be added in the grid.
- The Edit Filters dialog will display on clicking in the Filters cell.
- Click the New button to create a rule. Use the drop down lists to set Expression to Fields.Quantity, Operator to "<" and Value to "
<Expression>". When you select "<Expression>" the Edit Expression dialog displays. This dialog allows you to select from predefined data (i.e. constants, database fields, report parameters, etc.) and create an expression with them. - Select Fields from the list on the bottom right of the dialog.
- Double-click "ReorderPoint" from the bottom middle list to add it to the expression.
-
Add to the expression at the top of the dialog so the complete expression reads "= Fields.ReorderPoint *.5". This rule will fire when the quantity of a product falls below half of the ReorderPoint value. Click OK to close the Edit Expression dialog.
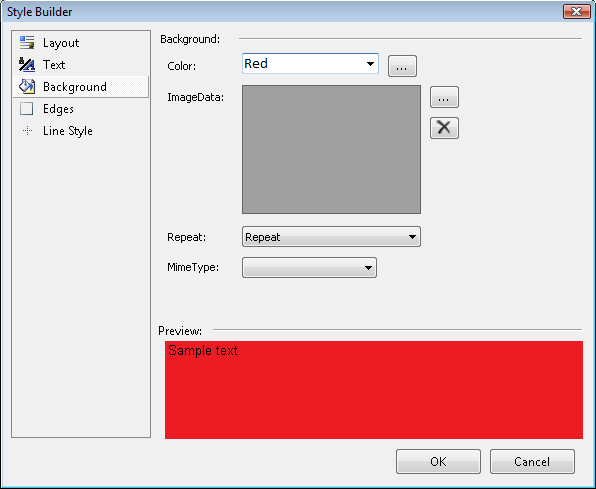
On the Conditional Formatting Rules dialog click the Style button to display the Style Builder dialog.
- Click Background from the list on the left and select "Red" from the Background Color drop down list.
-
Click OK to close the dialog.Click OK twice more to close the remaining rule dialogs.
Press F6 to build the report.
-
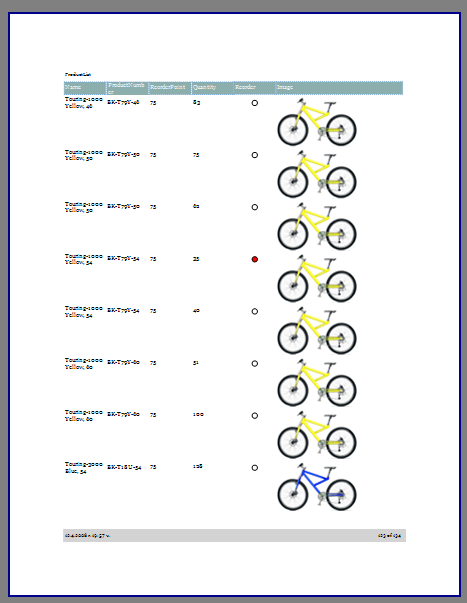
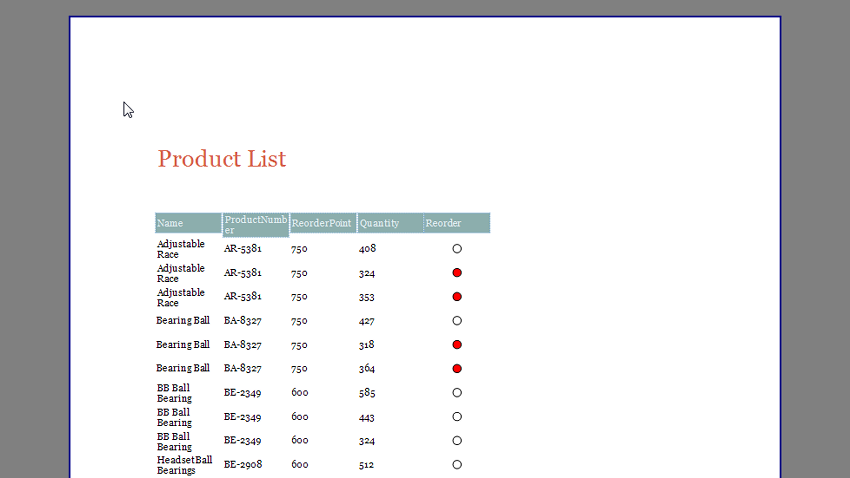
Click the Preview button to display the report. Scroll through the data and notice that the "Quantity" values that are below 50% of the "Reorder point" are displayed in red.
-
The last set of steps to building this report design add an image item to the report and format the page footer. These last steps also use the Data Explorer and the Report Explorer. From the Telerik Reporting menu select the Data Explorer.
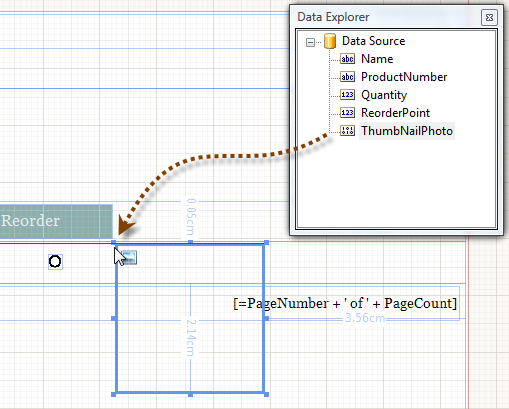
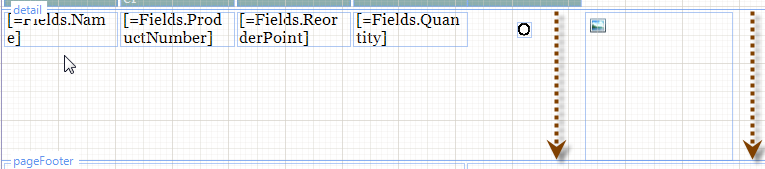
Select the "ThumbNailPhoto" column from the Data Explorer list and drag it to the detail section of the report designer, just to the right of the "Reorder" column. Notice that this step automatically creates a PictureBox report item.
-
After dropping the ThumbNailPhoto the DetailSection will be automatically resized to accommodate the entire PictureBox item:
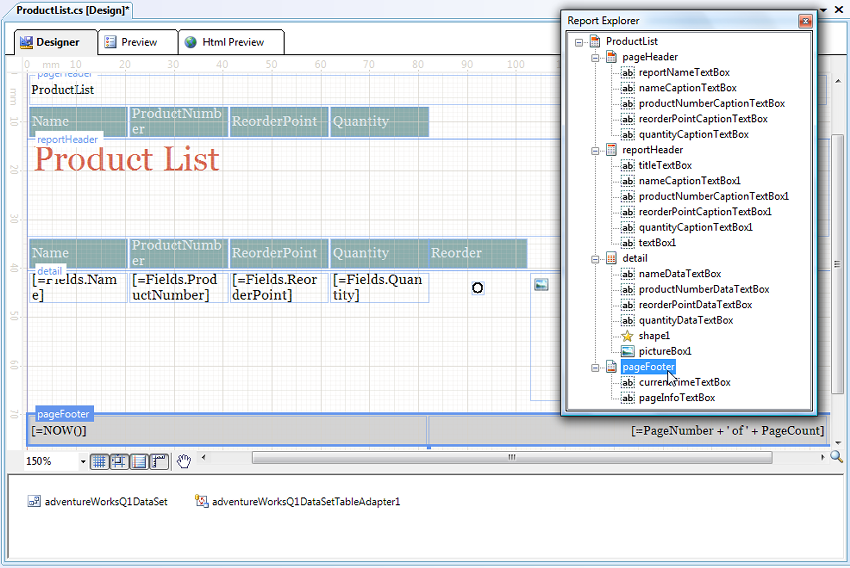
The Report Explorer provides a hierarchical view of all the report sections and items in the report design. This allows you to easily locate items that might otherwise be difficult to find in a visually complex report. From the Telerik Reporting menu select the Report Explorer.
-
Click "pageFooterSection1" to select the report page footer.
In the Properties window set the Style.BackgroundColor property to "LightGray".
-
Click the Preview button to view the report. Scroll through the report pages to find records that have images.