Bar
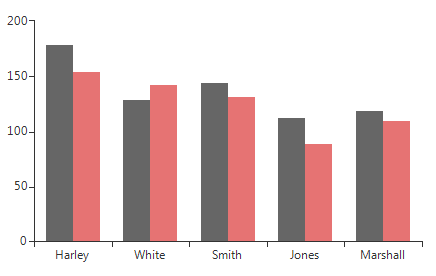
BarSeries are used to visualize data points as bar blocks where the height of each bar denotes the magnitude of its value. As a descendant of Categorical series, Bars require one categorical and one numerical axis. The following snippet demonstrates how to manually populate two BarSeries:
Initial Setup
BarSeries barSeries = new BarSeries("Performance", "RepresentativeName");
barSeries.Name = "Q1";
barSeries.DataPoints.Add(new CategoricalDataPoint(177, "Harley"));
barSeries.DataPoints.Add(new CategoricalDataPoint(128, "White"));
barSeries.DataPoints.Add(new CategoricalDataPoint(143, "Smith"));
barSeries.DataPoints.Add(new CategoricalDataPoint(111, "Jones"));
barSeries.DataPoints.Add(new CategoricalDataPoint(118, "Marshall"));
this.radChartView1.Series.Add(barSeries);
BarSeries barSeries2 = new BarSeries("Performance", "RepresentativeName");
barSeries2.Name = "Q2";
barSeries2.DataPoints.Add(new CategoricalDataPoint(153, "Harley"));
barSeries2.DataPoints.Add(new CategoricalDataPoint(141, "White"));
barSeries2.DataPoints.Add(new CategoricalDataPoint(130, "Smith"));
barSeries2.DataPoints.Add(new CategoricalDataPoint(88, "Jones"));
barSeries2.DataPoints.Add(new CategoricalDataPoint(109, "Marshall"));
this.radChartView1.Series.Add(barSeries2);
Dim barSeries As New Telerik.WinControls.UI.BarSeries("Performance", "RepresentativeName")
barSeries.Name = "Q1"
barSeries.DataPoints.Add(New CategoricalDataPoint(177, "Harley"))
barSeries.DataPoints.Add(New CategoricalDataPoint(128, "White"))
barSeries.DataPoints.Add(New CategoricalDataPoint(143, "Smith"))
barSeries.DataPoints.Add(New CategoricalDataPoint(111, "Jones"))
barSeries.DataPoints.Add(New CategoricalDataPoint(118, "Marshall"))
Me.RadChartView1.Series.Add(barSeries)
Dim barSeries2 As New Telerik.WinControls.UI.BarSeries("Performance", "RepresentativeName")
barSeries2.Name = "Q2"
barSeries2.DataPoints.Add(New CategoricalDataPoint(153, "Harley"))
barSeries2.DataPoints.Add(New CategoricalDataPoint(141, "White"))
barSeries2.DataPoints.Add(New CategoricalDataPoint(130, "Smith"))
barSeries2.DataPoints.Add(New CategoricalDataPoint(88, "Jones"))
barSeries2.DataPoints.Add(New CategoricalDataPoint(109, "Marshall"))
Me.RadChartView1.Series.Add(barSeries2)
Figure 1: Initial Setup
BarSeries could be customized using the following properties:
ShowLabels: A Boolean property that indicates whether the labels of each bar should be displayed. The specific position of the labels is determined by the orientation (vertical or horizontal) and the CombineMode (None, Cluster, Stack, Stack100) of the bars.
-
LabelMode: Gets or sets the label mode of the BarSeries. It offers enumeration of three options:
- Default - Labels are positoned using the default strategy.
- Center - Each label is renderred at the center of its corresponding bar.
- Top - Each label is renderred at the top of its corresponding bar. If the area orientation is horizontal, the labels appear on the right of each bar.
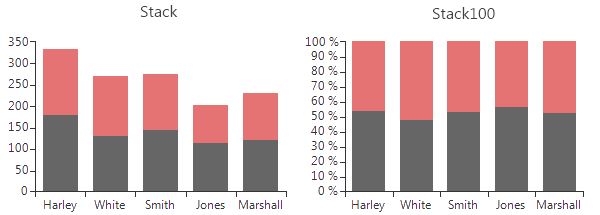
CombineMode: A common property for all categorical series, which introduces a mechanism for combining data points that reside in different series but have the same category. The combine mode can be None, Cluster, Stack and Stack100. None means that the series will be plotted independently of each other, so that they are overlapping. Cluster displays data points in the same category huddled close together. Stack plots the points on top of each other and Stack100 will display the value as percent. The combine mode is best described by a picture (Left - Stack, Right – Stack100).
Figure 2: Combine Mode
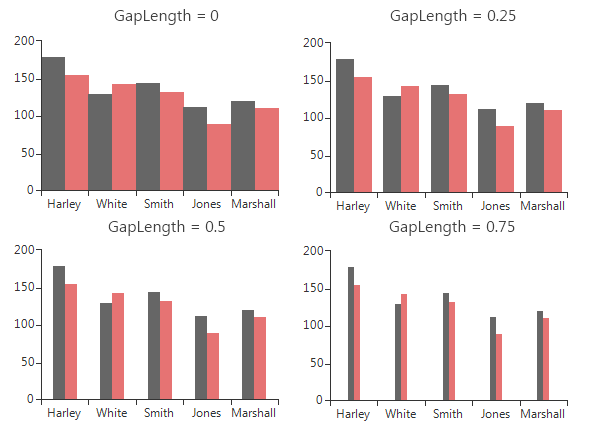
- GapLength: A property exposed by both CategoricalAxis and DateTimeContinuousAxis, which controls the distance between bar groups as percent. Note that the value should be between 0 and 1, where a value of 0 means that a bar would take the entire space between two ticks, while a value of 1 means the bar will have zero width as all the space should appear as gap. Here is how to set the GapLength.
Setting GapLength
(barSeries.HorizontalAxis as CategoricalAxis).GapLength = 0.75;
TryCast(barSeries.HorizontalAxis, CategoricalAxis).GapLength = 0.75
The following image demonstrates how different values of the GapLength property change the BarSeries:
Figure 3: Gap Length
- StackGroupKey all cartesian series that support stacking can be grouped in separate stacks. Here are four BarSeries stacked into two groups:
Figure 4: Stacked BarSeries
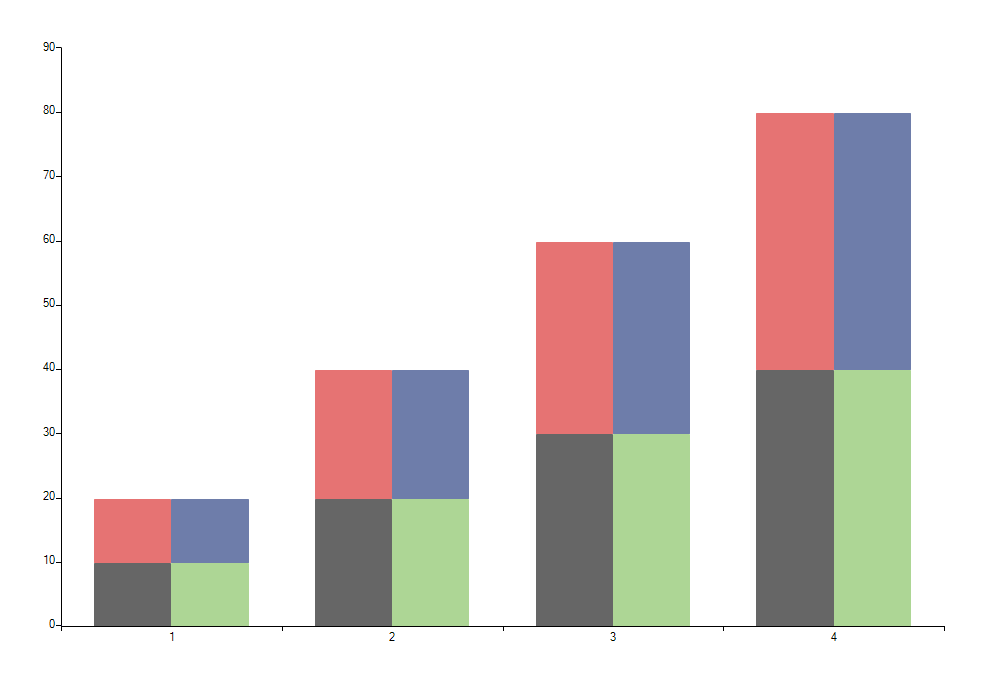
To achieve this add four BarSeries and set the StackGroupKey property of two of them to 1.