Structure
This article describes the inner structure and organization of the elements which build the RadChartView control.
The element hierarchy and structure will vary depending on the area and series types displayed in RadChartView.
Cartesian Area
The featured example illustrates the hierarchy defined by two BarSeries added to RadChartView.
Figure 1: RadChartView`s Element Hierarchy
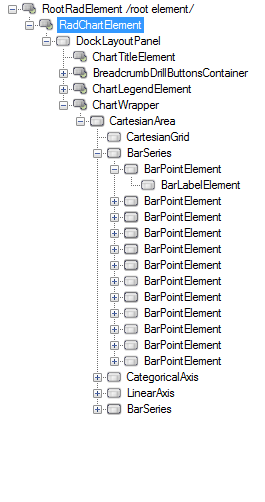
Figure 2: RadChartViews`s Structure
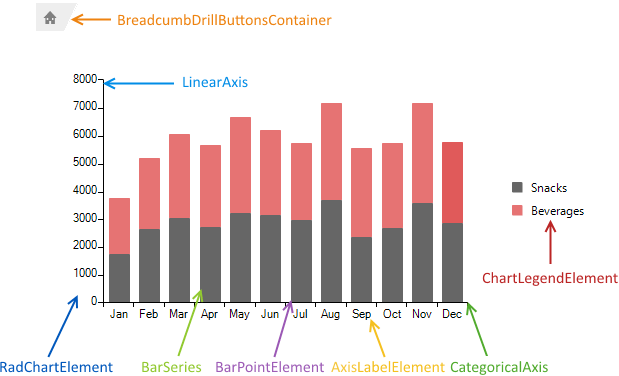
- RadChartElement: Represents the main element of RadChartView.
- BreadcrumbDrilButtonsContainer: Container element of the buttons needed by the DrillDownController.
- ChartLegendElement: Element defining the legend of the chart.
- BarSeries: Each of the series displayed in RadChartView.
-
BarPointElement: A single visual element representing a logical data point.
- BarLabelElement: A point label.
- CategoricalAxes: The horizontal axis of the chart.
- LinearAxis: The vertical axis of the chart.
Polar Area
The featured example illustrates the hierarchy defined by one RadarSeries added to RadChartView.
Figure 3: RadChartView`s Element Hierarchy
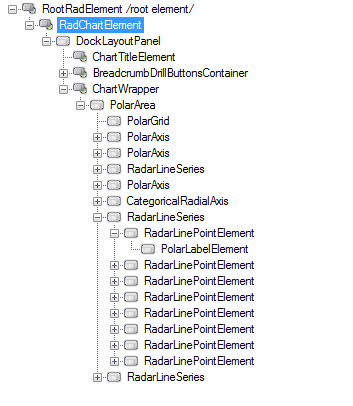
Figure 4: RadChartViews`s Structure
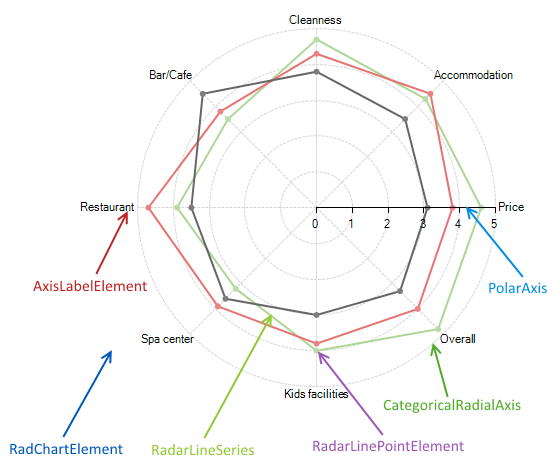
- RadChartElement: Represents the main element of RadChartView.
- RadarLineSeries: Each of the series displayed in RadChartView.
-
RadarLinePointElement: A single visual element representing a logical data point.
- CategoricalRadialAxis: Categorical axis of the series.
- PolarAxis: Polar axis of the series.
- AxisLabelElement: Axis label.
Pie Area
The featured example illustrates the hierarchy defined by three PieSeries added to RadChartView.
Figure 5: RadChartView`s Element Hierarchy
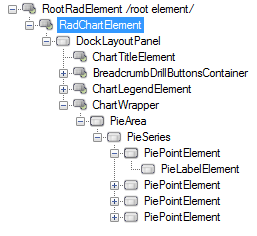
Figure 6: RadChartViews`s Structure
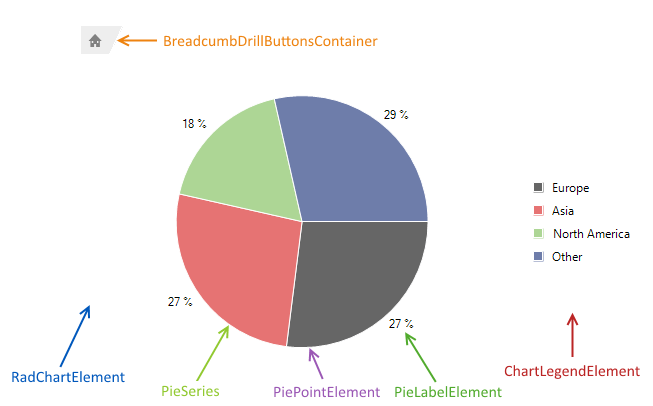
- RadChartElement: Represents the main element of RadChartView.
- BreadcrumbDrilButtonsContainer: Container element of the buttons needed by the DrillDownController.
- ChartLegendElement: Element defining the legend of the chart.
- PieSeries: Each of the series displayed in RadChartView.
-
PiePointElement: A single visual element representing a logical data point.
- PieLabelElement: A point label.