Donut
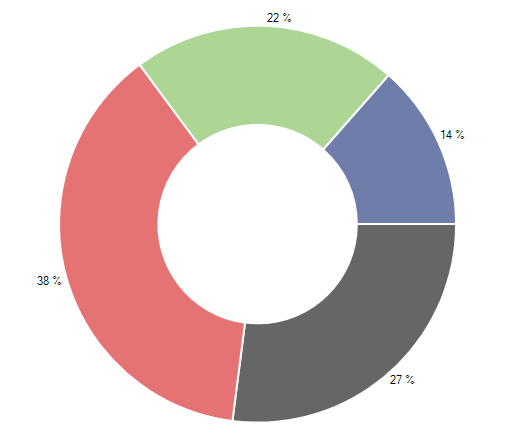
Similarly to Pie series, Donut series do not use axes. They visualize each data point as a slice with arc size directly proportional to the magnitude of the raw data point’s value. It is important to note that the donut series are valid only in the context of Pie AreaType. Donut pieces represent data in one dimension contrasting with the other series which represent data in two dimensions. Here is an example of how to create donut series populated with data:
Initial Setup
this.radChartView1.AreaType = ChartAreaType.Pie;
DonutSeries series = new DonutSeries();
series.DataPoints.Add(new PieDataPoint(50, "Germany"));
series.DataPoints.Add(new PieDataPoint(70, "United States"));
series.DataPoints.Add(new PieDataPoint(40, "France"));
series.DataPoints.Add(new PieDataPoint(25, "United Kingdom"));
series.ShowLabels = true;
this.radChartView1.Series.Add(series);
Me.RadChartView1.AreaType = ChartAreaType.Pie
Dim series As New DonutSeries()
series.DataPoints.Add(New PieDataPoint(50, "Germany"))
series.DataPoints.Add(New PieDataPoint(70, "United States"))
series.DataPoints.Add(New PieDataPoint(40, "France"))
series.DataPoints.Add(New PieDataPoint(25, "United Kingdom"))
series.ShowLabels = True
Me.RadChartView1.Series.Add(series)
Figure 1: Initial Setup
DonutSeries can be customized using the following properties:
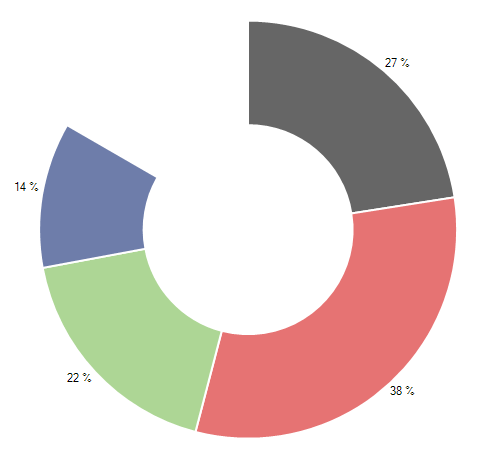
- Range: The property consists of two parameters StartAngle and SweepAngle. StartAngle sets the angle in degrees from which the drawing of the pie segments will begin. Note that pie slices are always rendered in clockwise direction. SweepAngle determines if the chart will appear as a full circle or a partial circle. The snippet below illustrates DonutSeries how to set the Range property:
AngleRange
AngleRange range = new AngleRange(270, 300);
series.Range = range;
Dim range As New AngleRange(270, 300)
series.Range = range
Figure 2: AngleRange
ShowLabels: The property determines whether the labels above each point will be visible.
RadiusFactor: The property can increase and decrease the diameter of the series. Setting the RadiusFactor to 0.9 will decrease the radius of the series by 10 percent. Similarly, the value 1.1 will increase it. Leaving the property with value 1 will make the donut fill the available space.
InnerRadiusFactor: The property is used to determine the inner radius of the donut series. Like RadiusFactor, its value is used as a percentage of the whole radius, if the RadiusFactor factor is set the value will be calculated according to the entire new radius.
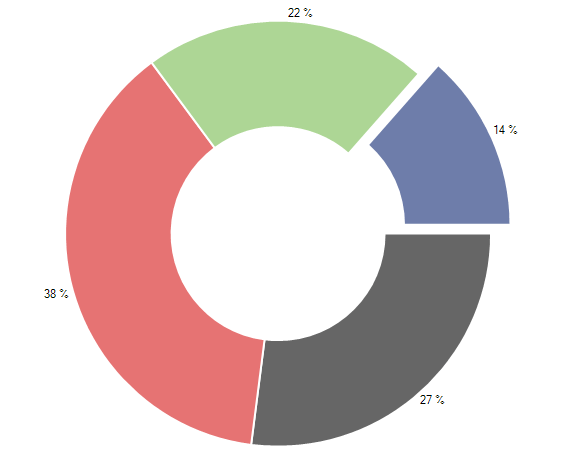
Additionally, DonutSeries allows offsetting a pie segment from the rest of the slices. This is achieved through the OffsetFromCenter property of the individual PieDataPoint. The following snippet demonstrates how to shift the first pie piece:
Donut Offset
PieDataPoint point = series.DataPoints[3] as PieDataPoint;
if (point != null)
{
    point.OffsetFromCenter = 0.1;
}
Dim point As PieDataPoint = TryCast(series.DataPoints(3), PieDataPoint)
If point IsNot Nothing Then
    point.OffsetFromCenter = 0.1
End If
Figure 3: Donut Offset