Radar
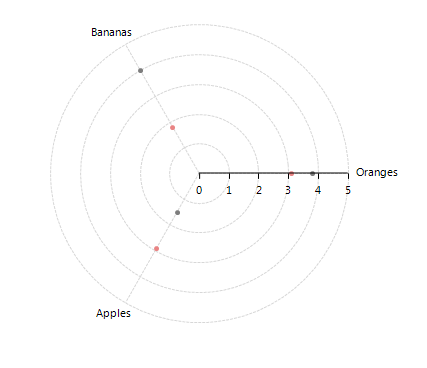
The radar chart is a two-dimensional chart of three or more quantitative variables represented on axes starting from the same point. As a derivative of PolarSeries, RadarSeries are valid only the context of Polar AreaType. RadChartView supports the following RadarSeries implementations out of the box: RadarPointSeries, RadarLineSeries and RadarAreaSeries. Below are three snippets that illustrate how to set up each of these series:
Initial Setup RadarPointSeries
this.radChartView1.AreaType = ChartAreaType.Polar;
RadarPointSeries radarPointSeries = new RadarPointSeries();
radarPointSeries.DataPoints.Add(new CategoricalDataPoint(3.8d, "Oranges"));
radarPointSeries.DataPoints.Add(new CategoricalDataPoint(4d, "Bananas"));
radarPointSeries.DataPoints.Add(new CategoricalDataPoint(1.5d, "Apples"));
this.radChartView1.Series.Add(radarPointSeries);
RadarPointSeries radarPointSeries2 = new RadarPointSeries();
radarPointSeries2.DataPoints.Add(new CategoricalDataPoint(3.1d, "Oranges"));
radarPointSeries2.DataPoints.Add(new CategoricalDataPoint(1.8d, "Bananas"));
radarPointSeries2.DataPoints.Add(new CategoricalDataPoint(2.9d, "Apples"));
this.radChartView1.Series.Add(radarPointSeries2);
Me.RadChartView1.AreaType = ChartAreaType.Polar
Dim radarPointSeries As New RadarPointSeries()
radarPointSeries.DataPoints.Add(New CategoricalDataPoint(3.8D, "Oranges"))
radarPointSeries.DataPoints.Add(New CategoricalDataPoint(4D, "Bananas"))
radarPointSeries.DataPoints.Add(New CategoricalDataPoint(1.5D, "Apples"))
Me.RadChartView1.Series.Add(radarPointSeries)
Dim radarPointSeries2 As New RadarPointSeries()
radarPointSeries2.DataPoints.Add(New CategoricalDataPoint(3.1D, "Oranges"))
radarPointSeries2.DataPoints.Add(New CategoricalDataPoint(1.8D, "Bananas"))
radarPointSeries2.DataPoints.Add(New CategoricalDataPoint(2.9D, "Apples"))
Me.RadChartView1.Series.Add(radarPointSeries2)
Figure 1: Initial Setup RadarPointSeries

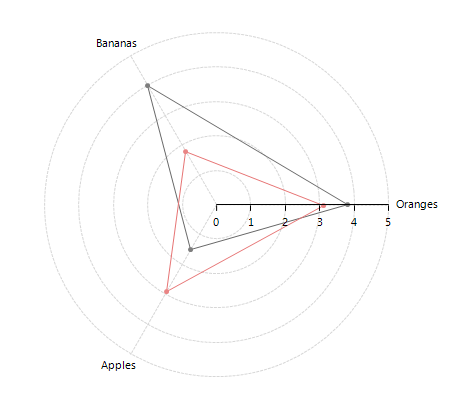
Initial Setup RadarLineSeries
this.radChartView1.AreaType = ChartAreaType.Polar;
RadarLineSeries radarLineSeries = new RadarLineSeries();
radarLineSeries.DataPoints.Add(new CategoricalDataPoint(3.8d, "Oranges"));
radarLineSeries.DataPoints.Add(new CategoricalDataPoint(4d, "Bananas"));
radarLineSeries.DataPoints.Add(new CategoricalDataPoint(1.5d, "Apples"));
this.radChartView1.Series.Add(radarLineSeries);
RadarLineSeries radarLineSeries2 = new RadarLineSeries();
radarLineSeries2.DataPoints.Add(new CategoricalDataPoint(3.1d, "Oranges"));
radarLineSeries2.DataPoints.Add(new CategoricalDataPoint(1.8d, "Bananas"));
radarLineSeries2.DataPoints.Add(new CategoricalDataPoint(2.9d, "Apples"));
this.radChartView1.Series.Add(radarLineSeries2);
Me.RadChartView1.AreaType = ChartAreaType.Polar
Dim radarLineSeries As New RadarLineSeries()
radarLineSeries.DataPoints.Add(New CategoricalDataPoint(3.8D, "Oranges"))
radarLineSeries.DataPoints.Add(New CategoricalDataPoint(4D, "Bananas"))
radarLineSeries.DataPoints.Add(New CategoricalDataPoint(1.5D, "Apples"))
Me.RadChartView1.Series.Add(radarLineSeries)
Dim radarLineSeries2 As New RadarLineSeries()
radarLineSeries2.DataPoints.Add(New CategoricalDataPoint(3.1D, "Oranges"))
radarLineSeries2.DataPoints.Add(New CategoricalDataPoint(1.8D, "Bananas"))
radarLineSeries2.DataPoints.Add(New CategoricalDataPoint(2.9D, "Apples"))
Me.RadChartView1.Series.Add(radarLineSeries2)
Figure 2: Initial Setup RadarLineSeries

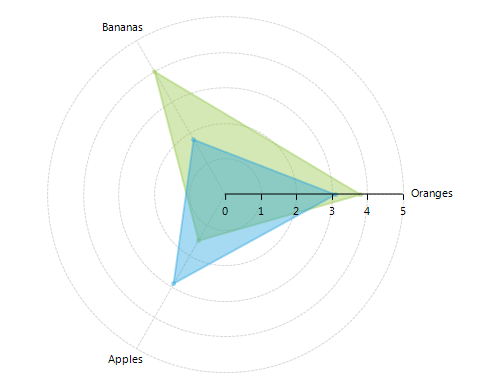
Initial Setup RadarAreaSeries
this.radChartView1.AreaType = ChartAreaType.Polar;
RadarAreaSeries radarAreaSeries = new RadarAreaSeries();
radarAreaSeries.BackColor = Color.FromArgb(100, 142, 196, 65);
radarAreaSeries.BorderColor = Color.FromArgb(100, 142, 196, 65);
radarAreaSeries.DataPoints.Add(new CategoricalDataPoint(3.8d, "Oranges"));
radarAreaSeries.DataPoints.Add(new CategoricalDataPoint(4d, "Bananas"));
radarAreaSeries.DataPoints.Add(new CategoricalDataPoint(1.5d, "Apples"));
this.radChartView1.Series.Add(radarAreaSeries);
RadarAreaSeries radarAreaSeries2 = new RadarAreaSeries();
radarAreaSeries2.BackColor = Color.FromArgb(100, 27, 157, 222);
radarAreaSeries2.BorderColor = Color.FromArgb(100, 27, 157, 222);
radarAreaSeries2.DataPoints.Add(new CategoricalDataPoint(3.1d, "Oranges"));
radarAreaSeries2.DataPoints.Add(new CategoricalDataPoint(1.8d, "Bananas"));
radarAreaSeries2.DataPoints.Add(new CategoricalDataPoint(2.9d, "Apples"));
this.radChartView1.Series.Add(radarAreaSeries2);
Me.RadChartView1.AreaType = ChartAreaType.Polar
Dim radarAreaSeries As New RadarAreaSeries()
radarAreaSeries.BackColor = Color.FromArgb(100, 142, 196, 65)
radarAreaSeries.BorderColor = Color.FromArgb(100, 142, 196, 65)
radarAreaSeries.DataPoints.Add(New CategoricalDataPoint(3.8D, "Oranges"))
radarAreaSeries.DataPoints.Add(New CategoricalDataPoint(4D, "Bananas"))
radarAreaSeries.DataPoints.Add(New CategoricalDataPoint(1.5D, "Apples"))
Me.RadChartView1.Series.Add(radarAreaSeries)
Dim radarAreaSeries2 As New RadarAreaSeries()
radarAreaSeries2.BackColor = Color.FromArgb(100, 27, 157, 222)
radarAreaSeries2.BorderColor = Color.FromArgb(100, 27, 157, 222)
radarAreaSeries2.DataPoints.Add(New CategoricalDataPoint(3.1D, "Oranges"))
radarAreaSeries2.DataPoints.Add(New CategoricalDataPoint(1.8D, "Bananas"))
radarAreaSeries2.DataPoints.Add(New CategoricalDataPoint(2.9D, "Apples"))
Me.RadChartView1.Series.Add(radarAreaSeries2)
Figure 3: Initial Setup RadarAreaSeries

Here are some of the important properties all PolarSeries share:
CategoryMember: The property indicates the name of the property in the datasource that holds data about the category.
ValueMember: The property determines the name of the property in the datasource that contains information about radial coordinate (the radius).
PointSize: The property determines the size of the drawn points in all three polar series.
BorderWidth: The property indicates the width of the lines in RadarLineSeries and RadarAreaSeries.
RadarSplineSeries
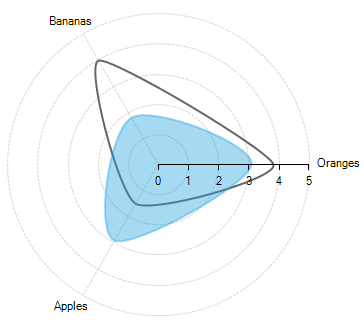
When you have RadarLineSeries or RadarAreaSeries you can set the Spline property and smoth the values transition (the SplineTension property):
Spline Settings
this.radChartView1.AreaType = ChartAreaType.Polar;
RadarLineSeries radarLineSeries = new RadarLineSeries();
radarLineSeries.DataPoints.Add(new CategoricalDataPoint(3.8d, "Oranges"));
radarLineSeries.DataPoints.Add(new CategoricalDataPoint(4d, "Bananas"));
radarLineSeries.DataPoints.Add(new CategoricalDataPoint(1.5d, "Apples"));
radarLineSeries.Spline = true;
radarLineSeries.SplineTension = 0.3f;
this.radChartView1.Series.Add(radarLineSeries);
RadarAreaSeries radarAreaSeries2 = new RadarAreaSeries();
radarAreaSeries2.BackColor = Color.FromArgb(100, 27, 157, 222);
radarAreaSeries2.BorderColor = Color.FromArgb(100, 27, 157, 222);
radarAreaSeries2.DataPoints.Add(new CategoricalDataPoint(3.1d, "Oranges"));
radarAreaSeries2.DataPoints.Add(new CategoricalDataPoint(1.8d, "Bananas"));
radarAreaSeries2.DataPoints.Add(new CategoricalDataPoint(2.9d, "Apples"));
radarAreaSeries2.Spline = true;
radarAreaSeries2.SplineTension = 0.5f;
this.radChartView1.Series.Add(radarAreaSeries2);
Me.RadChartView1.AreaType = ChartAreaType.Polar
Dim radarLineSeries As New RadarLineSeries()
radarLineSeries.DataPoints.Add(New CategoricalDataPoint(3.8, "Oranges"))
radarLineSeries.DataPoints.Add(New CategoricalDataPoint(4.0, "Bananas"))
radarLineSeries.DataPoints.Add(New CategoricalDataPoint(1.5, "Apples"))
radarLineSeries.Spline = True
radarLineSeries.SplineTension = 0.3F
Me.RadChartView1.Series.Add(radarLineSeries)
Dim radarAreaSeries2 As New RadarAreaSeries()
radarAreaSeries2.BackColor = Color.FromArgb(100, 27, 157, 222)
radarAreaSeries2.BorderColor = Color.FromArgb(100, 27, 157, 222)
radarAreaSeries2.DataPoints.Add(New CategoricalDataPoint(3.1, "Oranges"))
radarAreaSeries2.DataPoints.Add(New CategoricalDataPoint(1.8, "Bananas"))
radarAreaSeries2.DataPoints.Add(New CategoricalDataPoint(2.9, "Apples"))
radarAreaSeries2.Spline = True
radarAreaSeries2.SplineTension = 0.5F
Me.RadChartView1.Series.Add(radarAreaSeries2)
Figure 4: Spline Settings
