Controlling Axis Range
The chart continuous axes have a notion of range which, by default, is calculated automatically based on the plotted data. The RadChartView axes allow to access information about the range or adjust the range manually.
Continuous axes are LinearAxis, LogarithmicAxis and DateTimeContinuousAxis. The CategoricalAxis and DateTimeCategoricalAxis don't have notion of range and the following information is not relevant for them.
The examples in the article work mostly with numeric values, but if you use the DateTimeContinuousAxis you will need to use DateTime.
Actual Range
The actual range is a read-only information that tells what are the real minimum and maximum properties of the axis. This concept exists to ensure that the axis range can be accessed regardless if it is calcuilated automatically or set manually.
To get the actual range, use the ActualRange property of the axis.
To get the actual range when the axis is zoom-in, use the ActualVisibleRange property of the axis. This gives information about the currently visible minimum and maximum.
To get the actual major step, use the ActualMajorStep property of the axis.
Getting the actual range of a LinearAxis
ValueRange<double> actualRange = linearAxis.ActualRange;
ValueRange<double> actualVisibleRange = linearAxis.ActualVisibleRange;
double actualMajorStep = linearAxis.ActualMajorStep;
ActualRangeChangedActualVisibleRangeChangedActualMajorStepChanged
Actual range and step changed event handlers
private void LinearAxis_ActualMajorStepChanged(object sender, EventArgs e)
{
    var axis = (LinearAxis)sender;
    double majorStep = axis.ActualMajorStep;
}

private void LinearAxis_ActualVisibleRangeChanged(object sender, NumericalRangeChangedEventArgs e)
{
    ValueRange<double> newRange = e.NewRange;
    ValueRange<double> oldRange = e.PreviousRange;
}

private void LinearAxis_ActualRangeChanged(object sender, NumericalRangeChangedEventArgs e)
{
    ValueRange<double> newRange = e.NewRange;
    ValueRange<double> oldRange = e.PreviousRange;
}
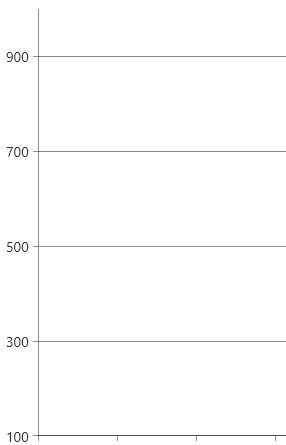
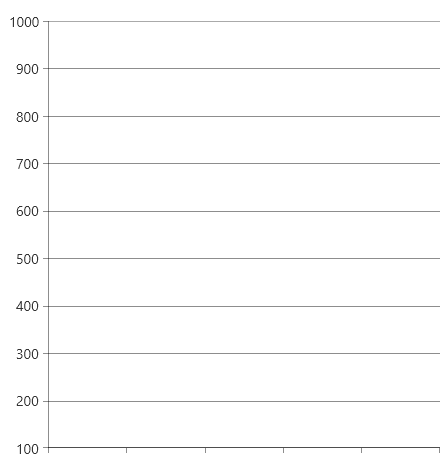
Setting the Range Manually
The axis range can be adjusted manually by setting the Minimum and Maximum properties of the axis.
Setting axis range in XAML
<telerik:LinearAxis Minimum="100" Maximum="1000" />

<telerik:DateTimeContinuousAxis Minimum="05/13/2024" Maximum="06/13/2024" />
Setting axis range in C#
this.linearAxis.Minimum = 100;
this.linearAxis.Maximum = 100;

this.dateTimeContinuousAxis.Minimum = DateTime.Today;
this.dateTimeContinuousAxis.Maximum = DateTime.Today.Months(12);
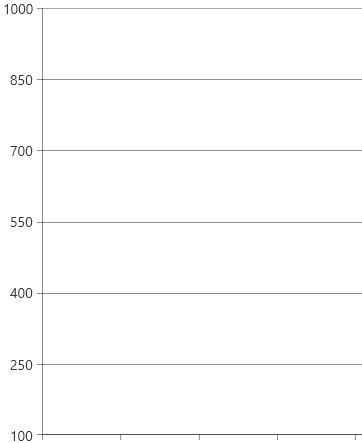
Setting the Step
The chart axes allow you to manually set the major and minor step, which determines the value distance between two adjacent ticks.
To set the major step, use the MajorStep property of the axis.
Setting major step
<telerik:LinearAxis Minimum="100" MajorStep="150" Maximum="1000" />
To get the actual major step, use the ActualMajorStep property of the axis. This is helpful if you don't assign the MajorStep property and rely on the automatically calculated one.
The minor step can be set with the MinorTicksPerMajor property of the axis. This determines how many minor ticks should be drawn between two adjacent major ticks. Read more about this feature in the Minor Ticks and Strips article.
The step in the DateTimeContinuousAxis works with two properties - the MajorStep and the MajorStepUnit which determines the time interval of the step. Read more in the Date Time Axes article.
The first major tick can be offset by setting the MajorTickOffset property of the axis. This determines which tick (by index) should be shown first. For example, setting the offset to 3 will skip three ticks before start rendering the ticks.
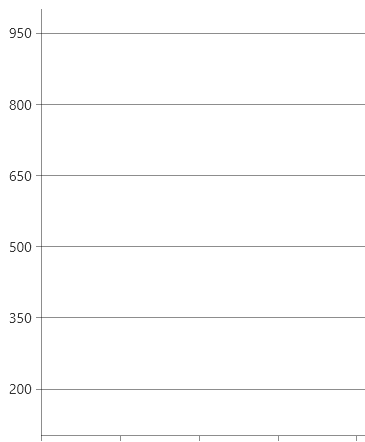
Setting the Tick Origin
The tick origin determines the value where the ticks originate. The positions of the ticks are determined based on the combination of the major step and tick origin values.
To set the origin, use the TickOrigin property of the axis (available in LinearAxis and DateTimeContinuousAxis).
Setting major step
<telerik:LinearAxis Minimum="100" TickOrigin="500" MajorStep="150" Maximum="1000" />
Setting the Desired Ticks Count
The axis allows you to set the desired tick count via the DesiredTickCount property. The axis will try to calculate a proper step based on the axis range and the desired number of ticks. Note, that the actual number of ticks may be slightly higher or lower since the automatic range calculation takes into account different factors and it tries to display a reasonable step between the ticks. For example, if the DesiredTickCount is 7, then 6 or 8 ticks may be drawn, depending on the range of the axis.
Setting desired number of ticks
<telerik:LinearAxis DesiredTickCount="5" />