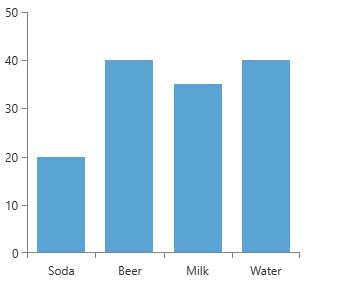
Categorical Axis
The categorical axis displays a set of categories. The values for each category do not define the order in which they appear. Here is an example of a categorical axis with a few data points.
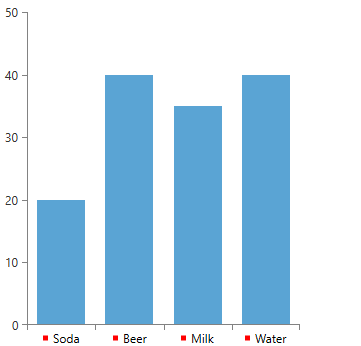
Example 1: Chart with categorical axis
Figure 1: Result from Example 1
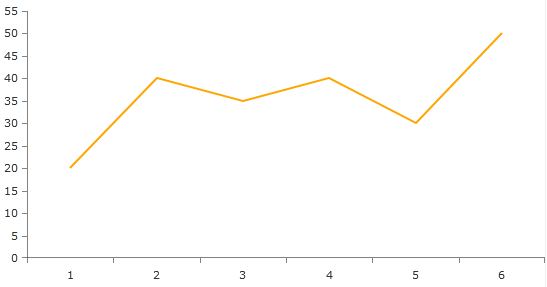
If a data point category is not defined, the series will set a category automatically. The category will be a numeric value determined by the position of the data point in the data source. For example, "1", "2", "3",etc."
Example 2: Chart with no category defined for datapoints
Figure 2: Result from Example 2
You can customize the CategoricalAxis by utilizing its LabelTemplate property. Here is a simple implementation of a rectangle added in the LabelTemplate.
Example 3: CategoricalAxis with LabelTemplate
Figure 3: Result from Example 3