Empty Data Points
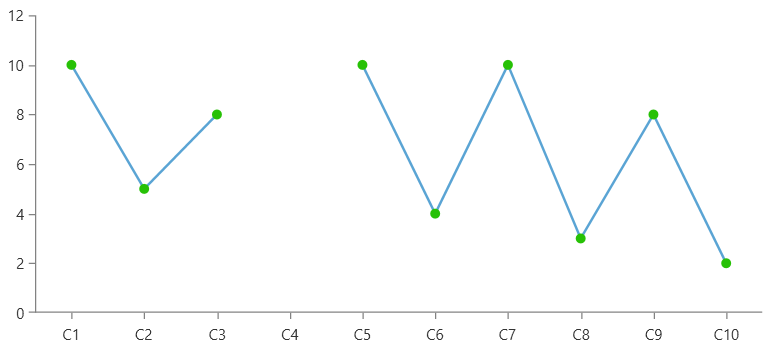
The RadCartesianChart control allows you to show gaps in the data without removing the associated data item. This is done by setting the value property of the corresponding data point to null. This is useful in different scenarios, like adding gaps in the line visualization or an empty bar for a specific category.
Adding an empty data point in LineSeries
<telerik:RadCartesianChart>
    <telerik:RadCartesianChart.VerticalAxis>
        <telerik:LinearAxis />
    </telerik:RadCartesianChart.VerticalAxis>
    <telerik:RadCartesianChart.HorizontalAxis>
        <telerik:CategoricalAxis PlotMode="OnTicksPadded" />
    </telerik:RadCartesianChart.HorizontalAxis>
    <telerik:LineSeries>
        <telerik:LineSeries.DefaultVisualStyle>
            <Style TargetType="Path">
                <Setter Property="Width" Value="8"/>
                <Setter Property="Height" Value="8"/>
                <Setter Property="Fill" Value="#27C106"/>
            </Style>
        </telerik:LineSeries.DefaultVisualStyle>
        <telerik:LineSeries.DataPoints>
            <telerik:CategoricalDataPoint Category="C1" Value="10" />
            <telerik:CategoricalDataPoint Category="C2" Value="5" />
            <telerik:CategoricalDataPoint Category="C3" Value="8" />
            <telerik:CategoricalDataPoint Category="C4" Value="{x:Null}" />
            <telerik:CategoricalDataPoint Category="C5" Value="10" />
            <telerik:CategoricalDataPoint Category="C6" Value="4" />
            <telerik:CategoricalDataPoint Category="C7" Value="10" />
            <telerik:CategoricalDataPoint Category="C8" Value="3" />
            <telerik:CategoricalDataPoint Category="C9" Value="8" />
            <telerik:CategoricalDataPoint Category="C10" Value="2" />
        </telerik:LineSeries.DataPoints>
    </telerik:LineSeries>
</telerik:RadCartesianChart>
The following example shows how to assign the value of the data point in code.
Creating an empty data point in code
this.lineSeries.DataPoints.Add(new CategoricalDataPoint() { Category = "C4", Value = null };

this.scatterLineSeries.DataPoints.Add(new ScatterDataPoint() { XValue = 4, YValue = null };
Data Binding Setup
When the chart series is data-bound via its ItemsSource property, the assignment of the null value is implemented in the data point models.
Defining the data point model
public class PlotInfo
{
    public string Category { get; set; }
    public double? Value { get; set; }
}
Populating with data
var dataItems = new ObservableCollection<PlotInfo>();
// add other data points here
dataItems.Add(new PlotInfo() { Category = "Category 4", Value = null };
// add other data points here
Setting up chart series in data binding scenario
<telerik:LineSeries CategoryBinding="Category" ValueBinding="Value" ItemsSource="{Binding MyDataItems}" />