Create Data-Bound Chart
RadChartView supports data binding and manual population with data out of the box. The data binding feature is exposed by the different series and can be utilized by assigning a value to the ItemsSource property of a series object. Each series has a collection of data points, that is, a data source which it displays according to the series type. For more information on chart series, please refer to our Chart Series topic. ItemsSource is of type IEnumerable and can therefore be bound to anything. If the data source is a collection of custom objects, users will have to provide a ValueBinding which will be used by the series to determine to which property the data points of the chart will be bound to.
If the data source consists of primitive numeric types (byte, short, int, float , double, decimal) the objects in the data source will be used directly as values for the data points. Here are two examples of how to bind RadChartView to a data source of primitive types and to a data source of custom objects.
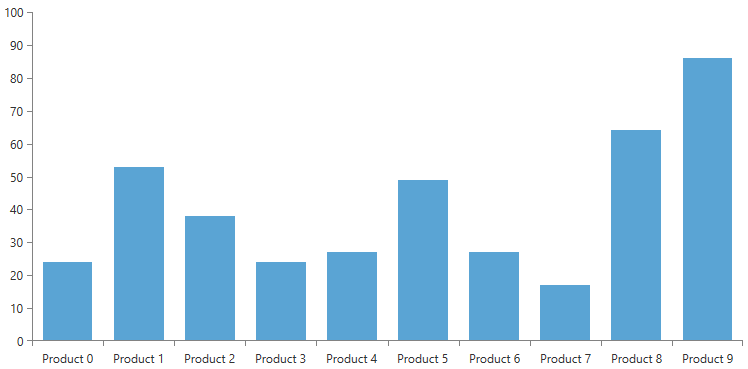
The following examples will demonstrate how to bind the BarSeries of the chart.
The DataPoints collection property of the series will be populated when their ItemsSource is used.
Binding in XAML
The series in a chart can be bound through XAML assuming the DataContext of our series is the data source. First we are going to create a ViewModel class which will hold our collection of Product. We will use the Product class define in the Example 1.
Example 1: Creating ViewModel class
public class Product
{
    public string Name { get; set; }
    public int QuantitySold { get; set; }
}
public class ViewModel
{
    public ObservableCollection<Product> Data { get; set; }
    Random rnd = new Random();
    public ViewModel()
    {
        Data = new ObservableCollection<Product>();
        GetData();
    }
    private void GetData()
    {
        for (int i = 0; i < 10; i++)
        {
            Product product = new Product();
            product.Name = "Product " + i;
            product.QuantitySold = rnd.Next(10,99) ;
            Data.Add(product);
        }
    }
}
Public Class ViewModel
    Public Property Data As ObservableCollection(Of Product)
    Private rnd As Random = New Random()
    Public Sub New()
        Data = New ObservableCollection(Of Product)()
        GetData()
    End Sub
    Private Sub GetData()
        For i As Integer = 0 To 10 - 1
            Dim product As Product = New Product()
            product.Name = "Product " & i
            product.QuantitySold = rnd.Next
            Data.Add(product)
        Next
    End Sub
End Class
The next step is to set the DataContext of the MainWindow to our ViewModel class.
Example 2: Specifying DataContext of the MainWindow
public MainWindow()
{
    InitializeComponent();
    this.DataContext = new ViewModel();
}
Public Sub New()
    InitializeComponent()
    Me.DataContext = New ViewModel()
End Sub
Example 3: Binding BarSeries in XAML
<telerik:RadCartesianChart x:Name="chart">

    <telerik:RadCartesianChart.HorizontalAxis>
        <telerik:CategoricalAxis/>
    </telerik:RadCartesianChart.HorizontalAxis>

    <telerik:RadCartesianChart.VerticalAxis>
        <telerik:LinearAxis/>
    </telerik:RadCartesianChart.VerticalAxis>

    <telerik:RadCartesianChart.Series>
        <telerik:BarSeries x:Name="barSeries" CategoryBinding="Name" ValueBinding="QuantitySold" ItemsSource="{Binding Data}"/>
    </telerik:RadCartesianChart.Series>
</telerik:RadCartesianChart>
Figure 1: Binding BarSeries in XAML

Binding BarSeries to primitive types
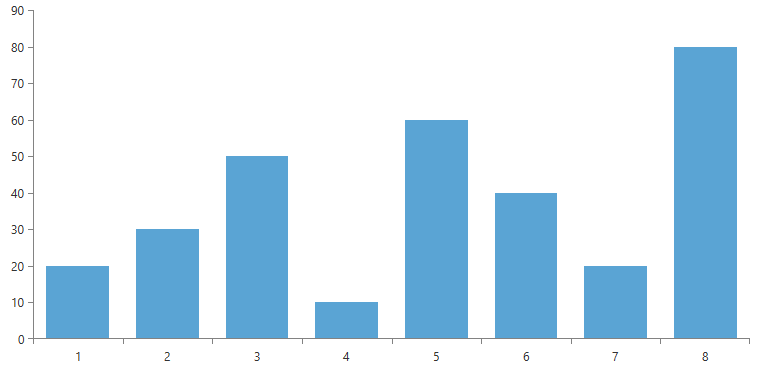
For any series object the data source can be set to an enumerable of primitive numerical types. In this case the data points' values will the values in the enumerable themselves. For example for any series object the following code binds it:
Example 3: Binding BarSeries in XAML
<telerik:RadCartesianChart x:Name="chart">

    <telerik:RadCartesianChart.HorizontalAxis>
        <telerik:CategoricalAxis/>
    </telerik:RadCartesianChart.HorizontalAxis>

    <telerik:RadCartesianChart.VerticalAxis>
        <telerik:LinearAxis/>
    </telerik:RadCartesianChart.VerticalAxis>

    <telerik:RadCartesianChart.Series>
        <telerik:BarSeries x:Name="barSeries" />
    </telerik:RadCartesianChart.Series>
</telerik:RadCartesianChart>
Example 4: Binding BarSeries to primitive types
public MainWindow()
{
    InitializeComponent();
    barSeries.ItemsSource = new double[] { 20, 30, 50, 10, 60, 40, 20, 80 };
}
Public Sub New()
    InitializeComponent()
    barSeries.ItemsSource = New Double() { 20, 30, 50, 10, 60, 40, 20, 80 }
End Sub
Figure 2: Binding BarSeries to primitive types

Binding BarSeries in code behind
Let's assume that we need to visualize how many products of certain types are sold for the last month. First we will create a product class and then we can bind a bar series to a collection of our products.
Example 5: Creating Product class
public class Product
{
    public string Name
    {
        get;
        set;
    }
    public double QuantitySold
    {
        get;
        set;
    }
}
Public Class Product
    Private _name As String
    Private _quantitySold As Double

    Public Property Name As String
        Get
            Return Me._name
        End Get
        Set(value As String)
            Me._name = value
        End Set
    End Property
    Public Property QuantitySold As Double
        Get
            Return Me._quantitySold
        End Get
        Set(value As Double)
            Me._quantitySold = value
        End Set
    End Property
End Class
Example 6: Binding BarSeries in code behind
List<Product> dataSource = new List<Product>();
dataSource.Add(new Product() { Name = "Product 1", QuantitySold = 5  });
dataSource.Add(new Product() { Name = "Product 2", QuantitySold = 50  });
dataSource.Add(new Product() { Name = "Product 3", QuantitySold = 8 });
barSeries.CategoryBinding = new PropertyNameDataPointBinding() { PropertyName = "Name" };
barSeries.ValueBinding = new GenericDataPointBinding<Product, double>() { ValueSelector = product => product.QuantitySold };
barSeries.ItemsSource = dataSource;
Dim dataSource As List(Of Product) = New List(Of Product)()
Dim nameBinding As PropertyNameDataPointBinding = New PropertyNameDataPointBinding
nameBinding.PropertyName = "Name"
Dim genericBinding As GenericDataPointBinding(Of Product, Double) = New GenericDataPointBinding(Of Product, Double)
genericBinding.ValueSelector = Function(product) product.QuantitySold
barSeries.CategoryBinding = nameBinding
barSeries.ValueBinding = genericBinding
barSeries.ItemsSource = dataSource
The two binding classes, ValueBinding and CategoryBinding are set so that the series knows which property to bind to the value of a data point and which property to bind to the category of a data point. RadChart supports two types of binding objects out of the box and these are PropertyNameDataPointBinding and GenericDataPointBinding. The two binding classes do the same thing but they have different performance characteristics. PropertyNameDataPointBinding uses reflection internally to lookup values which can be slow and is not recommended for real-time charts where the items in the data source are updated frequently. For static charts it is preferred because they are very easy to use. Also if binding is done through XAML, the PropertyNameDataPointBinding is the only approach. GenericDataPointBinding on the other hand has to be setup through code and is a lot faster because the user typically knows which property needs to be bound to the category or the value of the data points and can do the binding with a simple variable assignment, avoiding the slower reflection based approach.
If a series is bound to an observable collection, the series will update as soon as a property of a data item changes. If we needed to track the selling of our products in real-time, we can simply put the product types in an observable collection and whenever we update a product's sold quantity, the chart will be updated. For example:
Example 7: Binding BarSeries to ObservableCollection
ObservableCollection<Product> products = new ObservableCollection<Product>();
// fill collection
barSeries.CategoryBinding = new PropertyNameDataPointBinding() { PropertyName = "Name" };
barSeries.ValueBinding = new GenericDataPointBinding<Product, double>() { ValueSelector = product => product.QuantitySold };
barSeries.ItemsSource = products;
Dim products As ObservableCollection(Of Product) = New ObservableCollection(Of Product)
' fill collection '
Dim nameBinding As PropertyNameDataPointBinding = New PropertyNameDataPointBinding
nameBinding.PropertyName = "Name"
Dim genericBinding As GenericDataPointBinding(Of Product, Double) = New GenericDataPointBinding(Of Product, Double)
genericBinding.ValueSelector = Function(product) product.QuantitySold
barSeries.CategoryBinding = nameBinding
barSeries.ValueBinding = genericBinding
barSeries.ItemsSource = dataSource
The only requirement left for the code above to work is that our Product class needs to implement INotifyPropertyChanged and raise the PropertyChanged event when its QuantitySold property changes. In Example 8 we will inherit ViewModelBase class which implement INotifyPropertyChanged interface.
Example 8: Creating Product class
public class Product : ViewModelBase
{
    public string Name { get; set; }
    private int _quantitySold;

    public int QuantitySold
    {
        get { return _quantitySold; }
        set {
            _quantitySold = value;
            this.OnPropertyChanged("QuantitySold");
        }
    }
}