Multiple Axes
RadChartView allows you to define multiple horizontal and vertical axis elements in the Cartesian chart.
By default you can show a single horizontal and a single vertical axis by setting the HorizontalAxis and VerticalAxis properties of the RadCartesianChart control.
To include additional axes you can set also the HorizontalAxis or VerticalAxis properties of the corresponding chart series. You can add up to one additional (to the chart axes) horizontal and one vertical axis per series.
By default the additional axes will stack next to one another. You can control the alignment of an axis (top, left, bottom, right) by setting its
HorizontalLocationorVerticalLocationproperties.
The following sections show a couple of sample scenarios where you can use multiple axes.
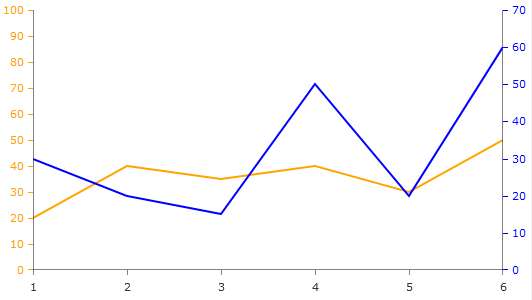
Two Vertical Axes
This example shows two chart series with a common horizontal axis and two vertical axes. In this case one of the series has its VerticalAxis property set and the other one uses the VerticalAxis of the RadCartesianChart.
 <telerik:RadCartesianChart>
    <telerik:RadCartesianChart.HorizontalAxis>
        <telerik:CategoricalAxis/>
    </telerik:RadCartesianChart.HorizontalAxis>

    <telerik:RadCartesianChart.VerticalAxis>
        <telerik:LinearAxis Maximum="100" ElementBrush="Orange"/>
    </telerik:RadCartesianChart.VerticalAxis>
    <telerik:RadCartesianChart.Series>
        <telerik:LineSeries Stroke="Orange" StrokeThickness="2">
            <telerik:LineSeries.DataPoints>
                <telerik:CategoricalDataPoint Value="20"/>
                <telerik:CategoricalDataPoint Value="40"/>
                <telerik:CategoricalDataPoint Value="35"/>
                <telerik:CategoricalDataPoint Value="40"/>
                <telerik:CategoricalDataPoint Value="30"/>
                <telerik:CategoricalDataPoint Value="50"/>
            </telerik:LineSeries.DataPoints>
        </telerik:LineSeries>

        <telerik:LineSeries Stroke="Blue" StrokeThickness="2">
            <telerik:LineSeries.VerticalAxis>
                <telerik:LinearAxis HorizontalLocation="Right" ElementBrush="Blue" />
            </telerik:LineSeries.VerticalAxis>
            <telerik:LineSeries.DataPoints>
                <telerik:CategoricalDataPoint Value="30"/>
                <telerik:CategoricalDataPoint Value="20"/>
                <telerik:CategoricalDataPoint Value="15"/>
                <telerik:CategoricalDataPoint Value="50"/>
                <telerik:CategoricalDataPoint Value="20"/>
                <telerik:CategoricalDataPoint Value="60"/>
            </telerik:LineSeries.DataPoints>
        </telerik:LineSeries>
    </telerik:RadCartesianChart.Series>
</telerik:RadCartesianChart>
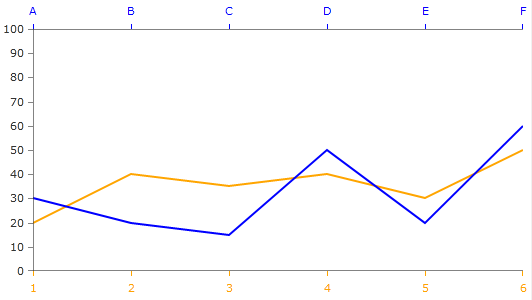
Two Horizontal Axes
This example shows two chart series with a common vertical axis and two horizontal axes. In this case one of the series has its HorizontalAxis property set and the other one uses the HorizontalAxis of the RadCartesianChart.
<telerik:RadCartesianChart>
    <telerik:RadCartesianChart.HorizontalAxis>
        <telerik:CategoricalAxis ElementBrush="Orange"/>
    </telerik:RadCartesianChart.HorizontalAxis>
    <telerik:RadCartesianChart.VerticalAxis>
        <telerik:LinearAxis Maximum="100"/>
    </telerik:RadCartesianChart.VerticalAxis>
    <telerik:RadCartesianChart.Series>
        <telerik:LineSeries Stroke="Orange" StrokeThickness="2">
            <telerik:LineSeries.DataPoints>
                <telerik:CategoricalDataPoint Value="20"/>
                <telerik:CategoricalDataPoint Value="40"/>
                <telerik:CategoricalDataPoint Value="35"/>
                <telerik:CategoricalDataPoint Value="40"/>
                <telerik:CategoricalDataPoint Value="30"/>
                <telerik:CategoricalDataPoint Value="50"/>
            </telerik:LineSeries.DataPoints>
        </telerik:LineSeries>
        <telerik:LineSeries Stroke="Blue" StrokeThickness="2">
            <telerik:LineSeries.HorizontalAxis>
                <telerik:CategoricalAxis ElementBrush="Blue" VerticalLocation="Top" />
            </telerik:LineSeries.HorizontalAxis>
            <telerik:LineSeries.DataPoints>
                <telerik:CategoricalDataPoint Category="A" Value="30"/>
                <telerik:CategoricalDataPoint Category="B" Value="20"/>
                <telerik:CategoricalDataPoint Category="C" Value="15"/>
                <telerik:CategoricalDataPoint Category="D" Value="50"/>
                <telerik:CategoricalDataPoint Category="E" Value="20"/>
                <telerik:CategoricalDataPoint Category="F" Value="60"/>
            </telerik:LineSeries.DataPoints>
        </telerik:LineSeries>
    </telerik:RadCartesianChart.Series>
</telerik:RadCartesianChart>
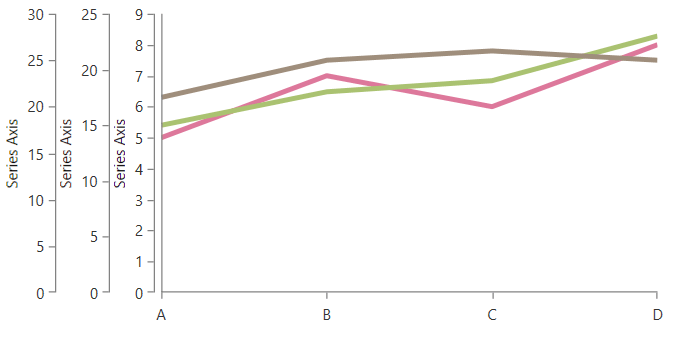
Multiple Axes and SeriesProvider
To define multiple axes for the different chart series when SeriesProvider is setup, you can use the SeriesCreated event of the provider. In the event handler, you can define a new instance of an axis to each series.
<telerik:ChartSeriesProvider Source="{Binding Data}"
                             SeriesCreated="ChartSeriesProvider_SeriesCreated">
    <telerik:CategoricalSeriesDescriptor CategoryPath="Category"
                                         ValuePath="Value"
                                         ItemsSourcePath="Items">
        <telerik:CategoricalSeriesDescriptor.Style>
            <Style TargetType="telerik:LineSeries">
                <Setter Property="StrokeThickness" Value="4" />
            </Style>
        </telerik:CategoricalSeriesDescriptor.Style>
    </telerik:CategoricalSeriesDescriptor>
</telerik:ChartSeriesProvider>
private void ChartSeriesProvider_SeriesCreated(object sender, ChartSeriesCreatedEventArgs e)
{
    var series = (CartesianSeries)e.Series;
    series.VerticalAxis = new LinearAxis() { Title = "Series Axis" };
}
Defining additional axis in a Style setter will apply the same axis instance to all series.