Multiple Chart Series
The chart controls allow you to add multiple series into the same chart instance. This way you can create multi-line, multi-bar charts, or any other combination of visualizations.
The following article discusses the RadCartesianChart control, but the same API can be used also in the other chart types.
To add multiple series instances, use the Series property of the chart.
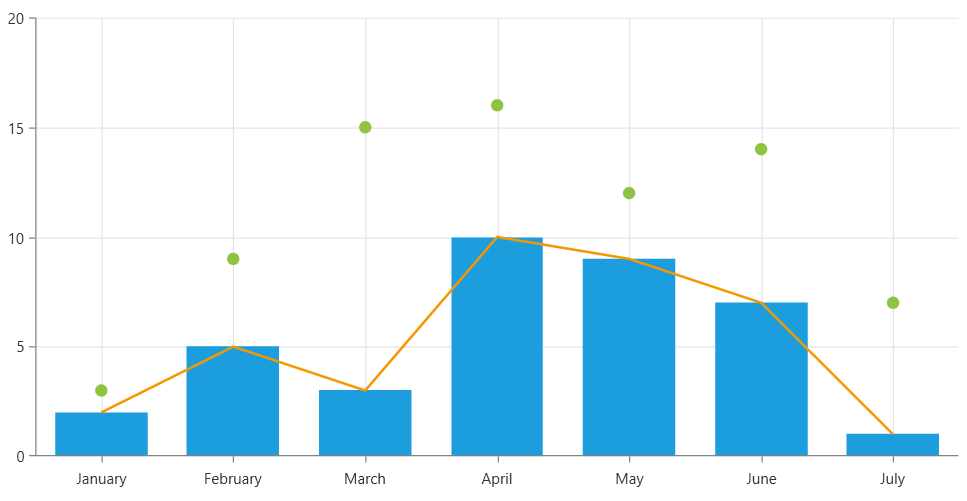
Defining chart with multiple visualizations
<telerik:RadCartesianChart Palette="Windows8">
    <telerik:RadCartesianChart.HorizontalAxis>
        <telerik:CategoricalAxis/>
    </telerik:RadCartesianChart.HorizontalAxis>
    <telerik:RadCartesianChart.VerticalAxis>
        <telerik:LinearAxis />
    </telerik:RadCartesianChart.VerticalAxis>
    <telerik:RadCartesianChart.Grid>
        <telerik:CartesianChartGrid MajorLinesVisibility="XY" />
    </telerik:RadCartesianChart.Grid>
    <telerik:RadCartesianChart.Series>
        <telerik:PointSeries>
            <telerik:PointSeries.DataPoints>
                <telerik:CategoricalDataPoint Category="January" Value="3" />
                <telerik:CategoricalDataPoint Category="February" Value="9" />
                <telerik:CategoricalDataPoint Category="March" Value="15" />
                <telerik:CategoricalDataPoint Category="April" Value="16" />
                <telerik:CategoricalDataPoint Category="May" Value="12" />
                <telerik:CategoricalDataPoint Category="June" Value="14" />
                <telerik:CategoricalDataPoint Category="July" Value="7" />
            </telerik:PointSeries.DataPoints>
        </telerik:PointSeries>
        <telerik:BarSeries>
            <telerik:BarSeries.DataPoints>
                <telerik:CategoricalDataPoint Category="January" Value="2" />
                <telerik:CategoricalDataPoint Category="February" Value="5" />
                <telerik:CategoricalDataPoint Category="March" Value="3" />
                <telerik:CategoricalDataPoint Category="April" Value="10" />
                <telerik:CategoricalDataPoint Category="May" Value="9" />
                <telerik:CategoricalDataPoint Category="June" Value="7" />
                <telerik:CategoricalDataPoint Category="July" Value="1" />
            </telerik:BarSeries.DataPoints>
        </telerik:BarSeries>
        <telerik:LineSeries>
            <telerik:LineSeries.DataPoints>
                <telerik:CategoricalDataPoint Category="January" Value="2" />
                <telerik:CategoricalDataPoint Category="February" Value="5" />
                <telerik:CategoricalDataPoint Category="March" Value="3" />
                <telerik:CategoricalDataPoint Category="April" Value="10" />
                <telerik:CategoricalDataPoint Category="May" Value="9" />
                <telerik:CategoricalDataPoint Category="June" Value="7" />
                <telerik:CategoricalDataPoint Category="July" Value="1" />
            </telerik:LineSeries.DataPoints>
        </telerik:LineSeries>
    </telerik:RadCartesianChart.Series>
</telerik:RadCartesianChart>
The different chart series work with different axis combinations. Keep that in mind when defining multiple series.
The previous example shows how to define a chart with static data. To add the data dynamically, you can populate the DataPoints collection in code, or you can use the data binding capabilities of the chart series.
Adding Multiple Series in MVVM Setup
In case an unknown number of series should be added dynamically, based on information defined in data models, the SeriesProvider feature of the chart can be used.