Scale Ticks
The BulletGraph enables you to control the appearance of its scale ticks.
Tick Interval
To set the interval between two adjacent ticks on the scale, use the TickStep property.
Set the TickStep
<Grid xmlns:dataVisualization="using:Telerik.UI.Xaml.Controls.DataVisualization">
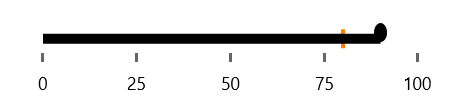
<dataVisualization:RadBulletGraph Height="50" Width="300" StartValue="0" EndValue="100" TickStep="25" />
</Grid>
TickStep set to 25.
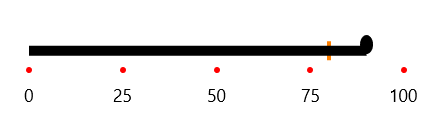
Styling the Ticks
To change the appearance of the scale ticks, use the TickTemplate property.
Set the TickTemplate
 <Grid xmlns:dataVisualization="using:Telerik.UI.Xaml.Controls.DataVisualization">
    <dataVisualization:RadBulletGraph Height="50" Width="300" StartValue="0" EndValue="100" TickStep="25">
        <dataVisualization:RadBulletGraph.TickTemplate>
            <DataTemplate>
                <StackPanel Orientation="Horizontal">
                    <Ellipse Fill="Red" Height="5" Width="5"/>
                </StackPanel>
            </DataTemplate>
        </dataVisualization:RadBulletGraph.TickTemplate>
    </dataVisualization:RadBulletGraph>
</Grid>