Comparative Measure
The comparative measure allows you to render a marker indicating a certain threshold or value in the context of the displayed data.
Using the Measure
The following example demonstrates how to use the ComparativeMeasure property to render the comparative measure.
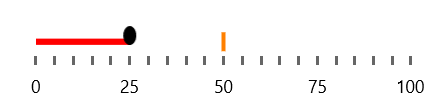
Set the ComparativeMeasure
<Grid xmlns:dataVisualization="using:Telerik.UI.Xaml.Controls.DataVisualization">
    <dataVisualization:RadBulletGraph Height="50" Width="300"
                                      StartValue="0"
                                      EndValue="100"
                                      FeaturedMeasure="25"
                                      FeaturedMeasureThickness="5"
                                      FeaturedMeasureBrush="Red"
                                      ComparativeMeasure="50" />
</Grid>
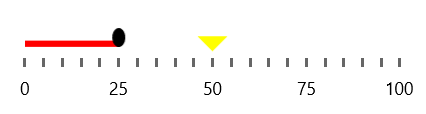
Customizing the Visual
You can also change the visualization for the comparative measure with the help of the ComparativeMeasureTemplate property.
Set the ComparativeMeasureTemplate
<Grid xmlns:dataVisualization="using:Telerik.UI.Xaml.Controls.DataVisualization">
    <dataVisualization:RadBulletGraph Height="50" Width="300"
                                      StartValue="0" EndValue="100"
                                      FeaturedMeasure="25"
                                      FeaturedMeasureThickness="5"
                                      FeaturedMeasureBrush="Red"
                                      ComparativeMeasure="50">
        <dataVisualization:RadBulletGraph.ComparativeMeasureTemplate>
            <DataTemplate>
                <Path Width="25" Height="25" Data="M 0 0 L 10 10 L 20 0 Z" Stretch="Uniform" Fill="Yellow"  />
            </DataTemplate>
        </dataVisualization:RadBulletGraph.ComparativeMeasureTemplate>
    </dataVisualization:RadBulletGraph>
</Grid>
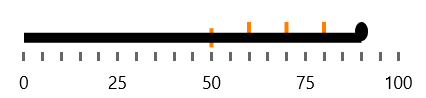
Multiple Comparative Measures
To add multiple comparative measures, use the AdditionalComparativeMeasures collection property of the BulletGraph.
Populate the AdditionalComparativeMeasures
<Grid xmlns:dataVisualization="using:Telerik.UI.Xaml.Controls.DataVisualization">
    <dataVisualization:RadBulletGraph Width="300" Height="50" EndValue="100" ComparativeMeasure="50">
        <dataVisualization:RadBulletGraph.AdditionalComparativeMeasures>
            <dataVisualization:BulletGraphComparativeMeasure Value="60" />
            <dataVisualization:BulletGraphComparativeMeasure Value="70" />
            <dataVisualization:BulletGraphComparativeMeasure Value="80" />
        </dataVisualization:RadBulletGraph.AdditionalComparativeMeasures>
    </dataVisualization:RadBulletGraph>
</Grid>