Featured Measure
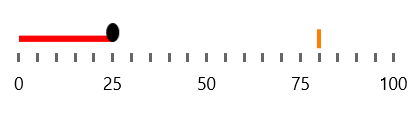
The BulletGraph enables you to visualize its featured measure.
Using the Measure
The following example demonstrates how to use the FeaturedMeasure, FeaturedMeasureThickness and FeaturedMeasureBrush properties in order to render the featured measure.
Set the FeaturedMeasure
<Grid xmlns:dataVisualization="using:Telerik.UI.Xaml.Controls.DataVisualization">
    <dataVisualization:RadBulletGraph Height="50" Width="300" StartValue="0" EndValue="100" FeaturedMeasure="25"  FeaturedMeasureThickness="5" FeaturedMeasureBrush="Red" />
</Grid>
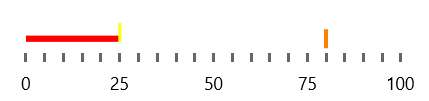
Customizing the Visual
You can also change the visualization for the end of the featured measure with the help of the FeaturedMeasureAlternativeTemplate property.
Set the FeaturedMeasureAlternativeTemplate
<Grid xmlns:dataVisualization="using:Telerik.UI.Xaml.Controls.DataVisualization">
    <dataVisualization:RadBulletGraph Height="50" Width="300" StartValue="0" EndValue="100" FeaturedMeasure="25" FeaturedMeasureThickness="5" FeaturedMeasureBrush="Red">
        <dataVisualization:RadBulletGraph.FeaturedMeasureAlternativeTemplate>
            <DataTemplate>
                <Rectangle Width="2" Height="15" Fill="Yellow" />
            </DataTemplate>
        </dataVisualization:RadBulletGraph.FeaturedMeasureAlternativeTemplate>
    </dataVisualization:RadBulletGraph>
</Grid>