Projected Measure
The projected measure is a visual element that allows comparing the progress shown as the featured measure.
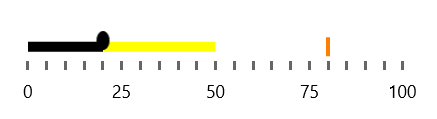
The following example demonstrates how to use the ProjectedMeasure and ProjectedMeasureBrush properties to render the projected measure.
Set the ProjectedMeasure
<Grid xmlns:dataVisualization="using:Telerik.UI.Xaml.Controls.DataVisualization">
    <dataVisualization:RadBulletGraph x:Name="bulletGraph" Width="300" Height="50" StartValue="0" EndValue="100" FeaturedMeasure="20" ProjectedMeasure="50" ProjectedMeasureBrush="Yellow"/>
</Grid>