Visual Structure
This article presents the visual elements of the BulletGraph component.
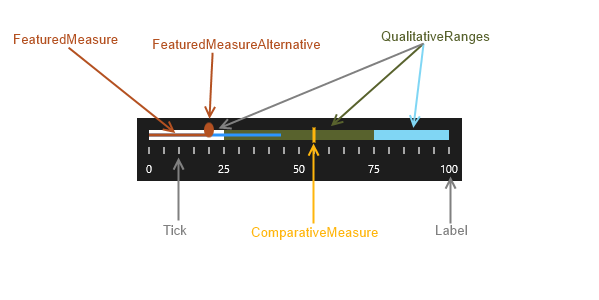
- Label—The visual representation of a value on the scale.
- Tick—Indicates the position of specific values on the scale.
- FeaturedMeasure—Represents the current progress in a BulletGraph.
-
FeaturedMeasureAlternative—Indicates the
EndValueof the featured measure. It is an ellipse by default. -
ProjectedMeasure—An indicator that starts from the
EndValueof theFeaturedMeasure. - Comparative Measure—A marker indicating a certain threshold or value in the context of the data that is displayed.
- Qualitative Ranges—Differently colored ranges, usually indicating bad, satisfactory, and good areas.