Chart Grid
In order to improve the readiness of the chart you may want to add grid-like visuals which support horizontal and vertical lines, associated with axis ticks and horizontal and vertical stripes for better readability. Depending on the chart that you use (RadCartesianChart or RadPolarChart) there are two types: CartesianChartGrid and PolarChartGrid that you can play with to add a decoration over the plot area.
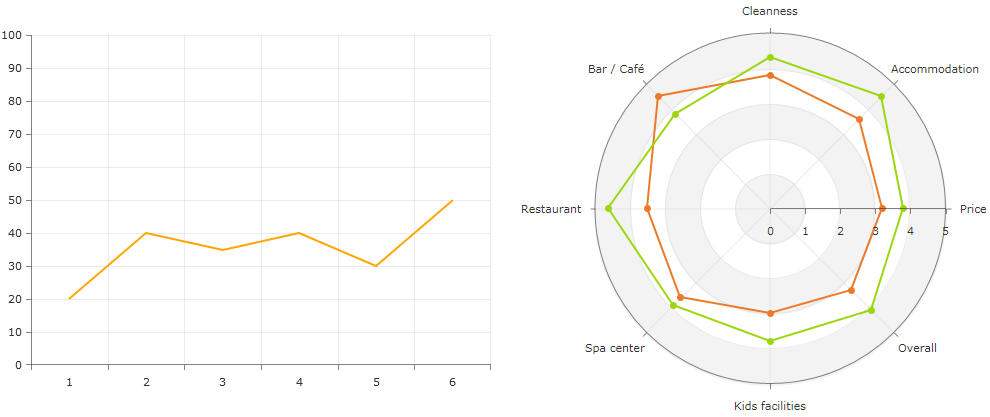
CartesianChartGrid
CartesianChartGrid shows horizontal and vertical lines and strips crossing the chart's plot area. The lines are snapped on the ticks of the axes and the strips is the area between the lines.
The grid allows you to customize its lines and strips via several properties. To use it, set the Grid property of RadCartesianChart to a new instance of CartesianChartGrid.
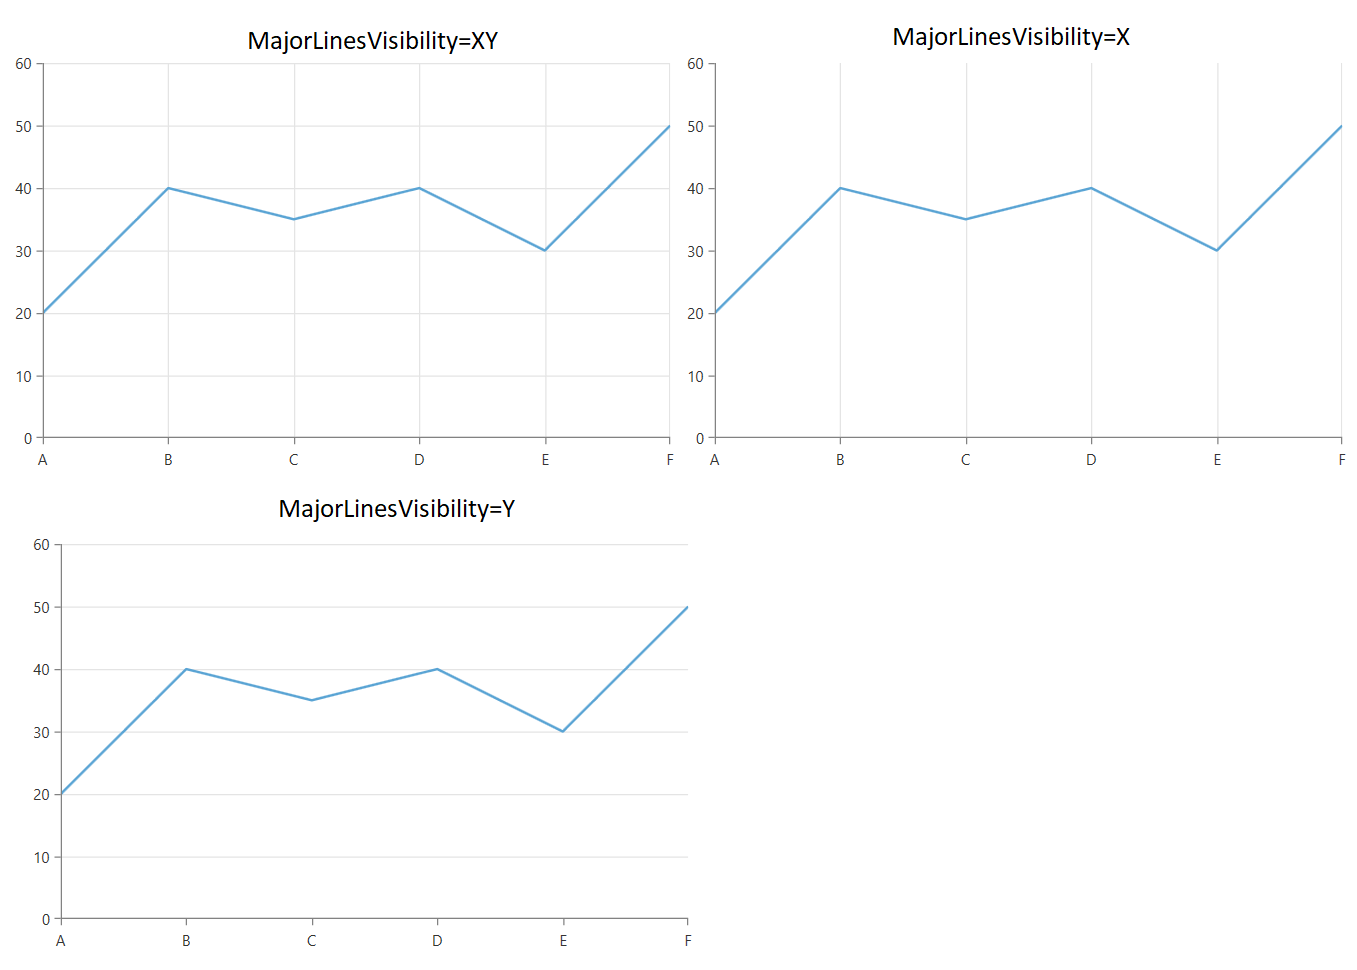
To display any lines in the grid, set the MajorLinesVisibility property. This is an enumeration that allows you to tell which lines to be displayed - vertical (X), horizontal (Y), both (XY) or None.
Example 1: Setting up the grid
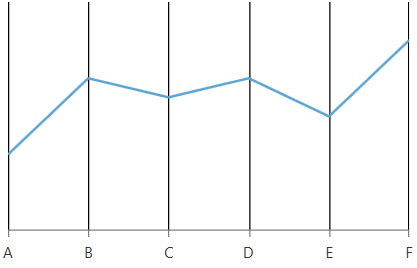
<telerik:RadCartesianChart>
    <telerik:RadCartesianChart.VerticalAxis>
        <telerik:LinearAxis />
    </telerik:RadCartesianChart.VerticalAxis>
    <telerik:RadCartesianChart.HorizontalAxis>
        <telerik:CategoricalAxis />
    </telerik:RadCartesianChart.HorizontalAxis>
    <telerik:LineSeries>
        <telerik:LineSeries.DataPoints>
            <telerik:CategoricalDataPoint Category="A" Value="20" />
            <telerik:CategoricalDataPoint Category="B" Value="40" />
            <telerik:CategoricalDataPoint Category="C" Value="35" />
            <telerik:CategoricalDataPoint Category="D" Value="40" />
            <telerik:CategoricalDataPoint Category="E" Value="30" />
            <telerik:CategoricalDataPoint Category="F" Value="50" />
        </telerik:LineSeries.DataPoints>
    </telerik:LineSeries>
    <telerik:RadCartesianChart.Grid>
        <telerik:CartesianChartGrid MajorLinesVisibility="XY" />
    </telerik:RadCartesianChart.Grid>
</telerik:RadCartesianChart>
Figure 1: Grid lines example
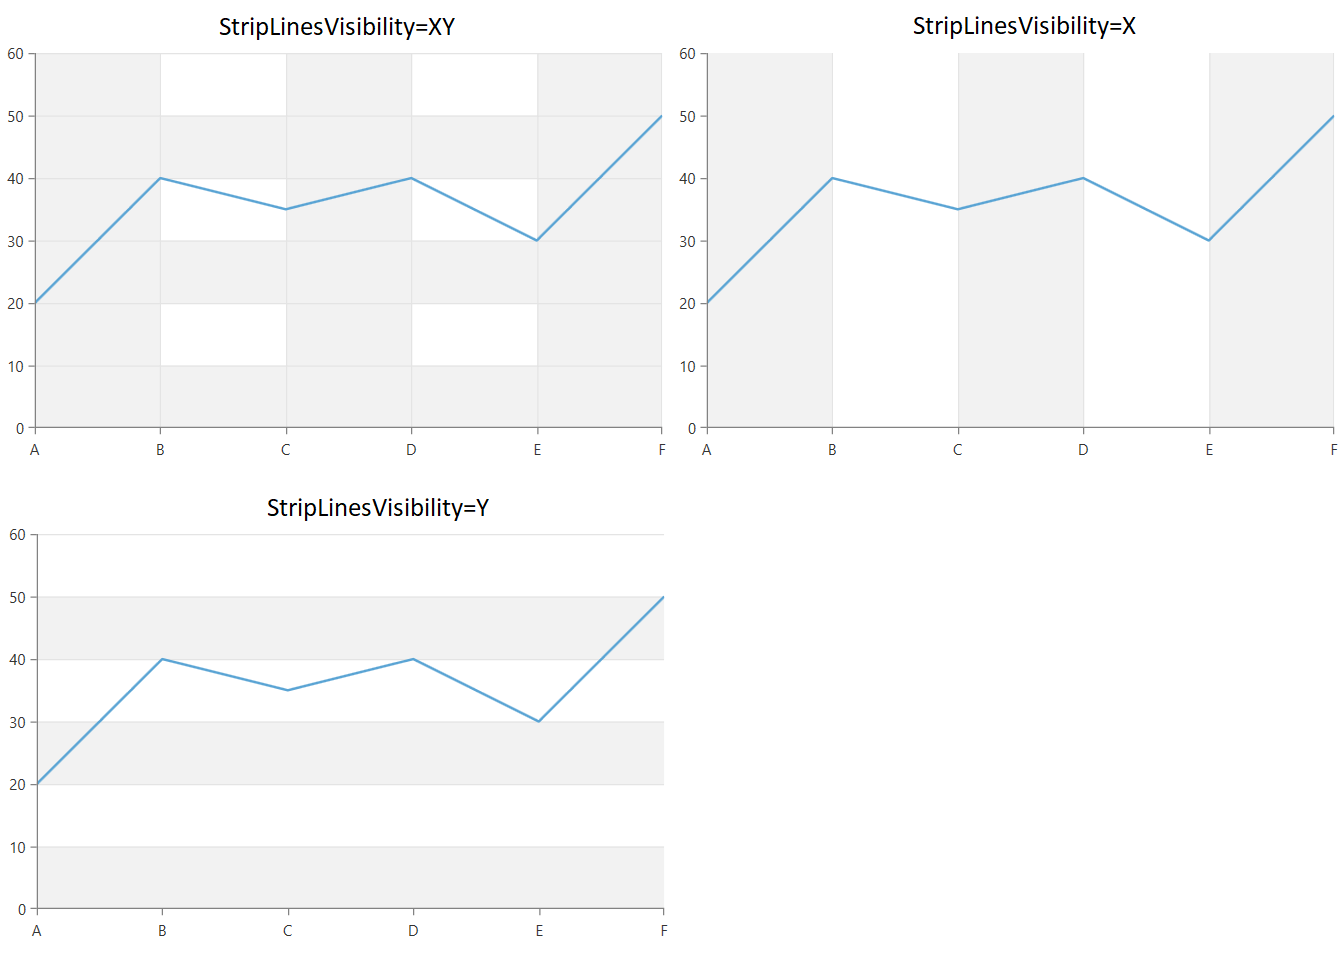
To display the strip lines, set the StripLinesVisibility property. This is an enumeration that allows you to tell which strips to be displayed - vertical (X), horizontal (Y), both (XY) or None.
Example 2: Enabling strip lines
<telerik:RadCartesianChart.Grid>
    <telerik:CartesianChartGrid MajorLinesVisibility="XY" StripLinesVisibility="XY" />
</telerik:RadCartesianChart.Grid>
Figure 2: Strip lines example
To show dashed lines, set the MajorXLineDashArray and MajorYLineDashArray properties.
Example 3: Dashing the grid lines
<telerik:RadCartesianChart.Grid>
    <telerik:CartesianChartGrid MajorXLineDashArray="5 5" MajorYLineDashArray="5 5" MajorLinesVisibility="XY" />
</telerik:RadCartesianChart.Grid>
Figure 3: Dash array example

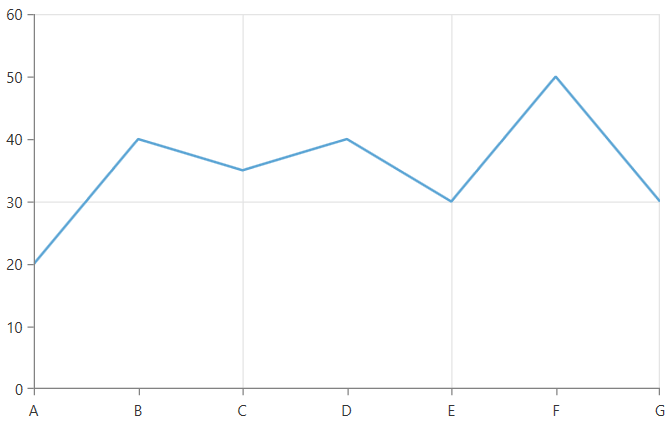
To define an interval for the grid lines to appear, set the MajorXLineInterval and MajorYLineInterval properties.
Example 4: Setting line interval
<telerik:RadCartesianChart.Grid>
    <telerik:CartesianChartGrid MajorXLineInterval="2" MajorYLineInterval="3" MajorLinesVisibility="XY" />
</telerik:RadCartesianChart.Grid>
Figure 4: Line interval example
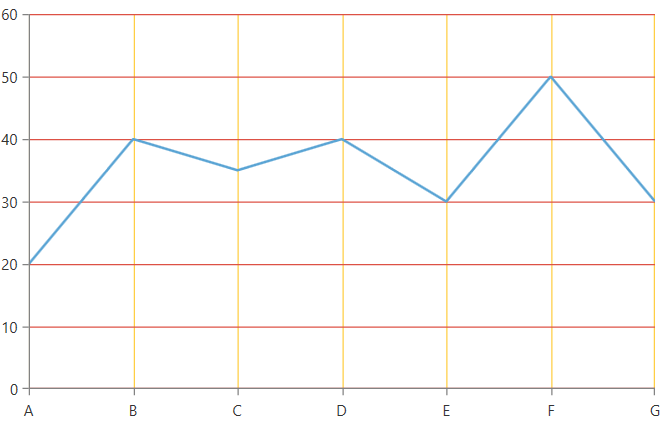
To change the appearance of the grid lines, set the MajorXLineStyle and MajorYLineStyle properties.
Example 5: Styling the grid lines
<telerik:RadCartesianChart.Grid>
    <telerik:CartesianChartGrid MajorLinesVisibility="XY">
        <telerik:CartesianChartGrid.MajorXLineStyle>
            <Style TargetType="Line">
                <Setter Property="Stroke" Value="#FFCE44" />
            </Style>
        </telerik:CartesianChartGrid.MajorXLineStyle>
        <telerik:CartesianChartGrid.MajorYLineStyle>
            <Style TargetType="Line">
                <Setter Property="Stroke" Value="#DD5145" />
            </Style>
        </telerik:CartesianChartGrid.MajorYLineStyle>
    </telerik:CartesianChartGrid>
</telerik:RadCartesianChart.Grid>
Figure 5: Grid lines with custom colors
Setting StrokeDashArray via the Line's Style is not supported. Use the MajorXLineDashArray and MajorYLineDashArray properties of CartesianChartGrid instead.
To change the colors of the strip lines, set the XStripeBrushes and YStripeBrushes properties.
Example 6: Coloring the strip lines
<telerik:RadCartesianChart.Grid>
    <telerik:CartesianChartGrid StripLinesVisibility="XY">
        <telerik:CartesianChartGrid.XStripeBrushes>
            <SolidColorBrush Color="Transparent" />
            <SolidColorBrush Color="Yellow" Opacity="0.2"/>
        </telerik:CartesianChartGrid.XStripeBrushes>
        <telerik:CartesianChartGrid.YStripeBrushes>
            <SolidColorBrush Color="Red" Opacity="0.2"/>
            <SolidColorBrush Color="Green" Opacity="0.2" />
            <SolidColorBrush Color="Transparent" />
        </telerik:CartesianChartGrid.YStripeBrushes>
    </telerik:CartesianChartGrid>
</telerik:RadCartesianChart.Grid>
Figure 6: Strip lines with custom colors
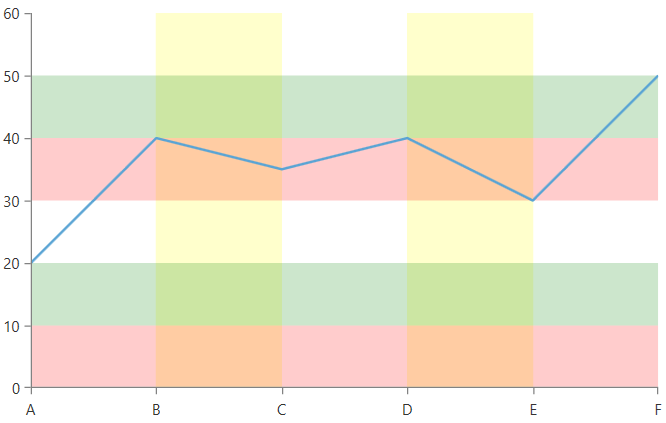
The X brushes are drawn from left to right. And the Y brushes from bottom to top.
Keep in mind that the horizontal (Y) strip lines are drawn over the vertical (X) strip lines.
To change the render mode of the grid lines, set the MajorXLinesRenderMode and MajorYLinesRenderMode. This is an enumeration of type GridLineRenderMode and it controls what lines will get rendered.
Example 7: Setting the grid lines render mode
<telerik:RadCartesianChart>
    <telerik:RadCartesianChart.VerticalAxis>
        <telerik:LinearAxis Visibility="Collapsed"/>
    </telerik:RadCartesianChart.VerticalAxis>
    <telerik:RadCartesianChart.HorizontalAxis>
        <telerik:CategoricalAxis />
    </telerik:RadCartesianChart.HorizontalAxis>
    <telerik:LineSeries>
        <telerik:LineSeries.DataPoints>
            <telerik:CategoricalDataPoint Category="A" Value="20" />
            <telerik:CategoricalDataPoint Category="B" Value="40" />
            <telerik:CategoricalDataPoint Category="C" Value="35" />
            <telerik:CategoricalDataPoint Category="D" Value="40" />
            <telerik:CategoricalDataPoint Category="E" Value="30" />
            <telerik:CategoricalDataPoint Category="F" Value="50" />
        </telerik:LineSeries.DataPoints>
    </telerik:LineSeries>
    <telerik:RadCartesianChart.Grid>
        <telerik:CartesianChartGrid MajorLinesVisibility="X" MajorXLinesRenderMode="Inner">
            <telerik:CartesianChartGrid.MajorXLineStyle>
                <Style TargetType="Line">
                    <Setter Property="Stroke" Value="Black" />
                </Style>
            </telerik:CartesianChartGrid.MajorXLineStyle>
        </telerik:CartesianChartGrid>
    </telerik:RadCartesianChart.Grid>
</telerik:RadCartesianChart>
-
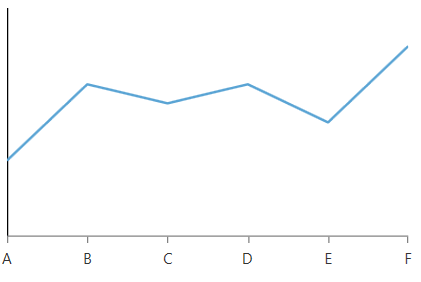
First: Only the first line is drawn.
-
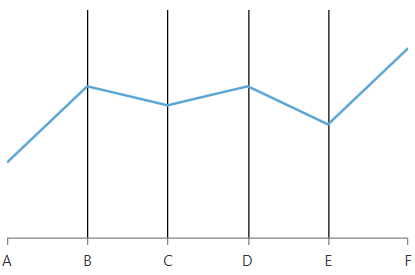
Inner: All lines, except the first and last, are drawn.
-
FirstAndInner: All lines, except the last, are rendered.
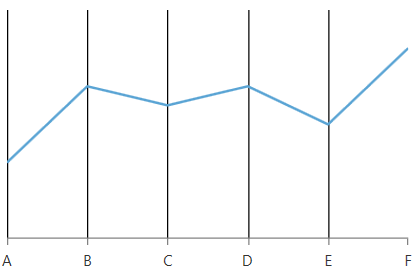
-
Last: Only the last line is rendered.
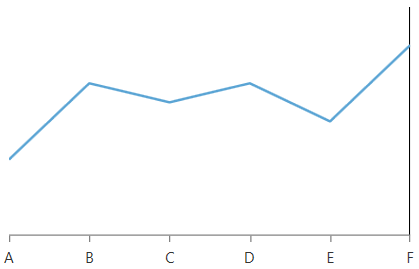
-
FirstAndLast: Only the first and the last lines are rendered.
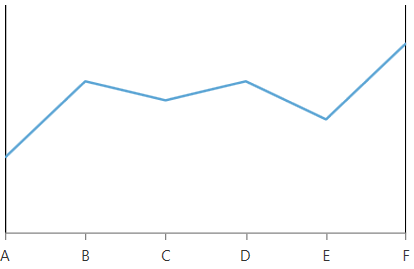
-
InnerAndLast: All lines, except the first, are rendered.
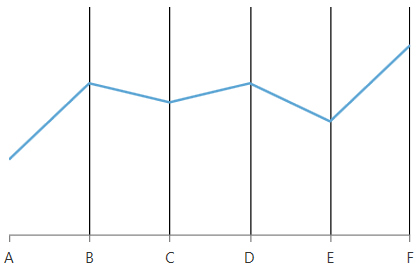
-
All: All lines are rendered. This is the default value.
PolarChartGrid
PolarChartGrid shows polar and radial lines and stripes drawn over the chart's plot area. The lines are snapped on the ticks of the axes and the stripes is the area between the lines.
The grid allows you to customize its lines and strips via several properties. To use it, set the Grid property of RadPolarChart to a new instance of PolarChartGrid.
To display the lines in the grid, set the GridLineVisibility property. This is an enumeration that allows you to tell which lines to be displayed - Polar, Radial, Both or None.
Example 8: Setting up the polar grid
<telerik:RadPolarChart>
    <telerik:RadPolarChart.RadialAxis>
        <telerik:CategoricalRadialAxis />
    </telerik:RadPolarChart.RadialAxis>
    <telerik:RadPolarChart.PolarAxis>
        <telerik:PolarAxis Minimum="0" Maximum="5" />
    </telerik:RadPolarChart.PolarAxis>
    <telerik:RadarLineSeries>
        <telerik:RadarLineSeries.DataPoints>
            <telerik:CategoricalDataPoint Category="A" Value="3.2" />
            <telerik:CategoricalDataPoint Category="B" Value="3.6" />
            <telerik:CategoricalDataPoint Category="C" Value="3.8" />
            <telerik:CategoricalDataPoint Category="D" Value="4.5" />
            <telerik:CategoricalDataPoint Category="E" Value="3.5" />
            <telerik:CategoricalDataPoint Category="F" Value="3.6" />
        </telerik:RadarLineSeries.DataPoints>
    </telerik:RadarLineSeries>
    <telerik:RadPolarChart.Grid>
        <telerik:PolarChartGrid GridLineVisibility="Both" />
    </telerik:RadPolarChart.Grid>
</telerik:RadPolarChart>
Figure 7: Polar grid lines example
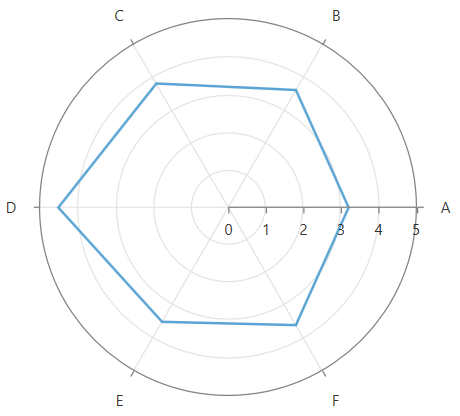
To display the strip lines, set the StripesVisibility property. This is an enumeration that allows you to tell which strips to be displayed - Polar, Radial, Both or None.
Example 9: Enabling polar strip lines
 <telerik:RadPolarChart.Grid>
    <telerik:PolarChartGrid StripesVisibility="Radial"/>
</telerik:RadPolarChart.Grid>
Figure 8: Polar strip lines example
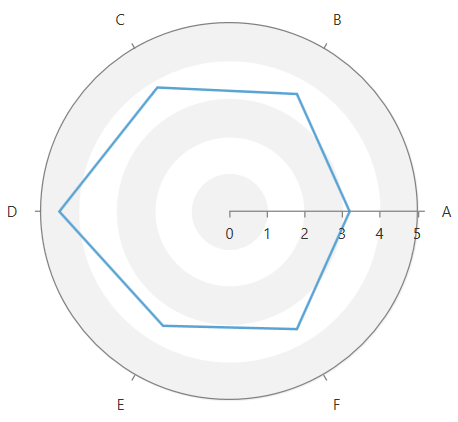
To show dashed lines, set the PolarLineDashArray and RadialLineDashArray properties.
Example 10: Dashing the polar grid lines
 <telerik:RadPolarChart.Grid>
    <telerik:PolarChartGrid GridLineVisibility="Both" PolarLineDashArray="4 4" RadialLineDashArray="10 5"/>
</telerik:RadPolarChart.Grid>
Figure 9: Dash array for the polar and radial grid lines example
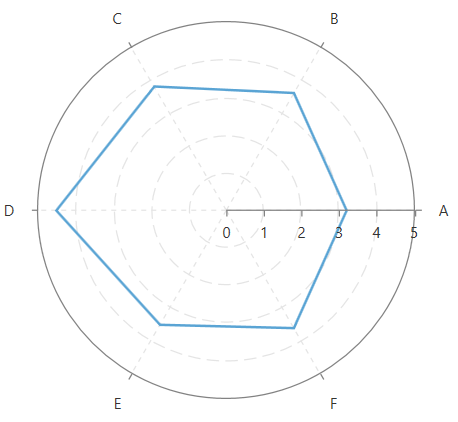
To change the appearance of the polar grid lines, set the RadialLineStyle and PolarLineStyle properties.
Example 11: Styling the polar grid lines
<telerik:RadPolarChart.Grid>
    <telerik:PolarChartGrid GridLineVisibility="Both">
        <telerik:PolarChartGrid.PolarLineStyle>
            <Style TargetType="Line">
                <Setter Property="Stroke" Value="OrangeRed" />
                <Setter Property="StrokeThickness" Value="3" />
            </Style>
        </telerik:PolarChartGrid.PolarLineStyle>
        <telerik:PolarChartGrid.RadialLineStyle>
            <Style TargetType="Ellipse">
                <Setter Property="Stroke" Value="OliveDrab" />
            </Style>
        </telerik:PolarChartGrid.RadialLineStyle>
    </telerik:PolarChartGrid>
</telerik:RadPolarChart.Grid>
Figure 10: Polar grid lines with custom colors and thickness
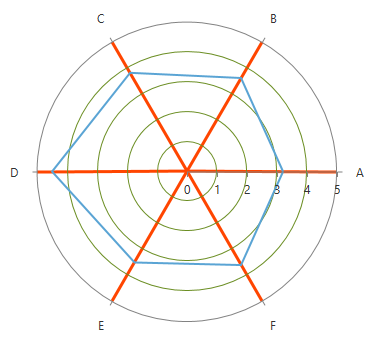
Setting StrokeDashArray via the Line or Ellipse's Style is not supported. Use the PolarLineDashArray and RadialLineDashArray properties of PolarChartGrid instead.
To change the colors of the polar strip lines, set the PolarStripeBrushes and RadialStripeBrushes properties.
Example 12: Coloring the strip lines
<telerik:RadPolarChart.Grid>
    <telerik:PolarChartGrid GridLineVisibility="Both" StripesVisibility="Both">
        <telerik:PolarChartGrid.PolarStripeBrushes>
            <SolidColorBrush Color="OrangeRed" Opacity="0.4" />
            <SolidColorBrush Color="YellowGreen" Opacity="0.4" />
        </telerik:PolarChartGrid.PolarStripeBrushes>
        <telerik:PolarChartGrid.RadialStripeBrushes>
            <SolidColorBrush Color="DarkOliveGreen"  />
            <SolidColorBrush Color="YellowGreen" />
        </telerik:PolarChartGrid.RadialStripeBrushes>
    </telerik:PolarChartGrid>
</telerik:RadPolarChart.Grid>
Figure 11: Strip lines with custom colors
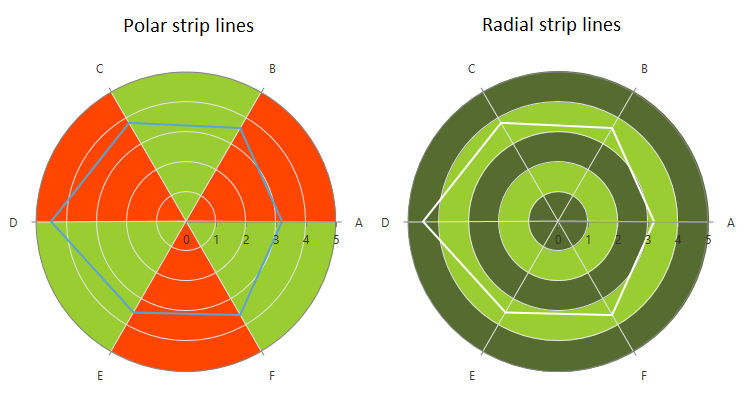
The radial strip lines are drawn from outside to inside. And the polar lines are drawn counter clockwise.
Keep in mind that the polar strip lines are drawn over the radial strip lines.